Plotting vertical grid to line graph
imageline ($im,$x2, $y_max,$x2,$y2,$grid_color);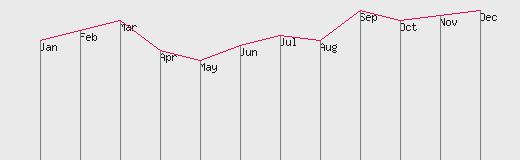
The two lines added here are marked in bold letters.
<?php

include "db.php";


$qt=mysql_query("select * from gd_graph");


$x_gap=40; // The gap between each point in y axis


$x_max=$x_gap*13; // Maximum width of the graph or horizontal axis

$y_max=160; // Maximum hight of the graph or vertical axis

// Above two variables will be used to create a canvas of the image//


$im = @ImageCreate ($x_max, $y_max);

or die ("Cannot Initialize new GD image stream");

$background_color = ImageColorAllocate ($im, 234, 234, 234);

$text_color = ImageColorAllocate ($im, 233, 14, 91);

$graph_color = ImageColorAllocate ($im,25,25,25);


$grid_color = ImageColorAllocate ($im,125,125,125);


$x1=0;

$y1=0;

$first_one="yes";

while($nt=mysql_fetch_array($qt)){

//echo "$nt[month], $nt[sales]";

$x2=$x1+$x_gap; // Shifting in X axis

$y2=$y_max-$nt[sales]; // Coordinate of Y axis

ImageString($im,2,$x2,$y2,$nt[month],$graph_color);


// Drawing the grid vertically//

imageline ($im,$x2, $y_max,$x2,$y2,$grid_color);


//Line above is to print month names on the graph

if($first_one=="no"){ // this is to prevent from starting $x1= and $y1=0

imageline ($im,$x1, $y1,$x2,$y2,$text_color); // Drawing the line between two points//

}

$x1=$x2; // Storing the value for next draw

$y1=$y2;

$first_one="no"; // Now flag is set to allow the drawing

}

//header ("Content-type: image/jpg");


ImageJPEG ($im);

?>
Line Chart Different types of graphs by using Google Charts
GD functions
Subscribe to our YouTube Channel here
This article is written by plus2net.com team.
https://www.plus2net.com

| adsf | 03-11-2014 |
| thanks you for usefull subjects | |