Bar Graph using HTML CanvasWe will be using rectangles to draw Bar on our Canvas. details of rectangles by changing its Height width and coordinates. Data FormatWe have class name, total Student in class as our graph. In Class-4 , we have total 150 students. We will create one JavaScript array with these data for all the classes.Inside the loop after drawing one bar (representing strength of a class ) we will move distance equal to bar_gap in X axis. In each step we calculate different values for x1 like this. x1=x; .... x=x+bar_gap; Understanding fillRect() for drawing BarsWe can draw rectangles as bars representing student data of the class. Note that rectangle coordinates starts from top left corners of the rectangle.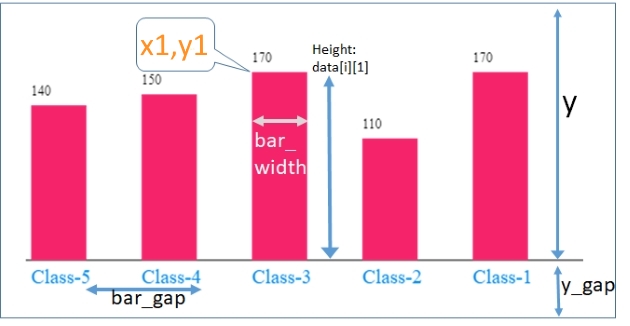
y1=y-data[i][1]; // Coordinate for top of the Bar
x1=x;
gctx.fillRect(x1, y1, width, height );
Here x1 , y1 are coordinates of the top left of the rectangle. Text ( Class name ) on GraphWe will write name of the class below the bar graph representing the class strength. Here base line is at a distance of y from top edge of the graph. We will move little down ( y – axis ) from this base line and display the text. Our class is available inside array as data[i][0].gctx.font = '18px serif'; // font for base label showing classes gctx.textAlign='left'; gctx.textBaseline='top'; gctx.fillStyle= '#008cf5'; gctx.fillText(data[i][0], x,y+5); // Write base text for classes Writing value at top of graphThe top left corner of the bar graph is represented by x1, y1. We will move little up by subtracting 20 from y1 ( y1-20 ) to display the value. The value is available inside array as data[i][[1]y1=y-data[i][1]; // Coordinate for top of the Bar x1 = x; gctx.font = '12px serif'; // font at top of the bar gctx.fillStyle= '#000000'; gctx.fillText(data[i][1], x1,y1-20); // text at top of the bar Adding shadow to graphgctx.shadowColor = '#000000'; gctx.shadowOffsetX=3; gctx.shadowOffsetY=3; gctx.shadowBlur = 3; Full Code is hereHTML Canvas<canvas id="my_canvas" width="35" height="230" style="border:2px solid #000000;"></canvas>JavaScript <script>
var my_canvas=document.getElementById("my_canvas");
var gctx=my_canvas.getContext("2d");
var data = [['Class-5',140],['Class-4',150],['Class-3',170],['Class-2',110],['Class-1',170]];
///////// Settings //////////
var bar_width=50;
var y_gap=30; // Gap below the graph
var bar_gap=100; // Gap between Bars including width of the bar
var x= 20; // Margin of graph from left
y=my_canvas.height -y_gap ;
my_canvas.width=data.length * ( bar_gap) + x ;
////////////end of settings ////
gctx.moveTo(x-5,y);
gctx.lineTo(my_canvas.width,y); // Base line of graph
gctx.stroke();
/// add shadow ///
gctx.shadowColor = '#000000';
gctx.shadowOffsetX=3;
gctx.shadowOffsetY=3;
gctx.shadowBlur = 3;
/////////// Draw the graph ////////
for (i=0;i<data.length;i++){
gctx.shadowColor = '#ffffff'; // remove this line if you shadow on text is required
gctx.font = '18px serif'; // font for base label showing classes
gctx.textAlign='left';
gctx.textBaseline='top';
gctx.fillStyle= '#008cf5';
gctx.fillText(data[i][0], x,y+5); // Write base text for classes
gctx.beginPath();
gctx.lineWidth=2;
y1=y-data[i][1]; // Coordinate for top of the Bar
x1 = x;
gctx.font = '12px serif'; // font at top of the bar
gctx.fillStyle= '#000000';
gctx.fillText(data[i][1], x1,y1-20); // text at top of the bar
gctx.fillStyle= '#f52369'; // fill Colur of bar
gctx.shadowColor = '#000000'; // shadow color for bars
gctx.fillRect(x1,y1,bar_width,data[i][1]);// Filled bar
x=x+bar_gap
}// end of for loop
</script>
This article is written by plus2net.com team.

|