Pie Chart using HTML CanvasData formatWe have three dimensional array with data, label and colour of the segment. Here is the sample.var data = [[40, 'Available','green'],[15,'Blocked','#f0f000'],[20, 'Sold','#f00000']]; Canvas SizeWe can fix the Pia chart radious, based on this value the canvas height and width can be changed. We kept some margin for labelsmy_canvas.width=my_canvas.height=(radious * 2 ) + radious/4; Understanding Angles of Arc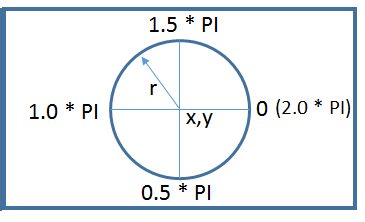 Each data element in our array represents one segment of the pia chart. We will transform this data to relative angle in radian of the Pie Chart.
The sum of all data ( variable total ) is equal to 360 degree or 2* PI ( 2* Math.Pi ) in this Circle or Pie Chart.
Each data element in our array represents one segment of the pia chart. We will transform this data to relative angle in radian of the Pie Chart.
The sum of all data ( variable total ) is equal to 360 degree or 2* PI ( 2* Math.Pi ) in this Circle or Pie Chart.
Inside the for loop for each data of our array we will find out radian angle of the segment representing the data like this. var angle= (data[i][0] * 2/total).toFixed(3) We used toFixed to manage decimal places. Above angle is in radian. Note that we draw arc between one start angle ( start_angle ) and one end angle ( end_angle ) . While starting or drawing the first segment the start angle =0 ; and end angle is equal to angle of the segment ( variable angle ) .While drawing the next segment (representing data ) the start_angle is equal to end_angle of previous segment and end_angle is equal to start_angle plus angle of the segment. var angle= (data[i][0] * 2/total).toFixed(3) // Angle of data segment in radian var end_angle=parseFloat(angle) + parseFloat(start_angle);After drawing the arc we assign value of end_angle to start_angle start_angle=end_angle; // start angle for next segment. 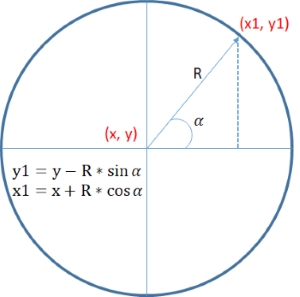
We can write text part of the data within the data segment. Herre we will find out half angle of the segment and x, y coordinates of the text point like this. text_angle=start_angle + ( ( end_angle - start_angle) / 2 ) y1=center_y+ 1.1*(radious)*Math.sin((text_angle)*Math.PI); x1=center_x+ 1.1*(radious)*Math.cos((text_angle)*Math.PI); Full Code is hereHTML Canvas<canvas id="my_canvas" width="35" height="230"</canvas>JavaScript <script>
var data=[[40,'Available','green'],[15, 'Blocked','#f0f000'], [20, 'Sold','#f00000'] ];
///////// No edit //////////
//var my_canvas=$('#my_canvas').get(0) // Jquery
var my_canvas=document.getElementById("my_canvas"); // JavaScript
var gctx = my_canvas.getContext("2d");
var radious=200; // Radious of Pie Chart
// Height and width of canvas is adjusted based on radious
my_canvas.width=my_canvas.height=(radious * 2 ) + radious/4;
// Center of the Pie chart
var center_x=my_canvas.width/2;
var center_y=my_canvas.height/2;
// Find out the sum of all data elements
var total=0;
for (i=0;i<data.length;i++)
{
total = total + data[i][0];
}
var x1=y1=0;
var start_angle=0;
for (i=0;i<data.length;i++)
{
gctx.beginPath();
gctx.shadowColor = 'black';
gctx.shadowOffsetX=5;
gctx.shadowOffsetY=5;
gctx.shadowBlur = 5;
var angle= (data[i][0] * 2/total).toFixed(3) // Angle of data segment in radian
var end_angle=parseFloat(angle) + parseFloat(start_angle);
gctx.moveTo(center_x,center_y); // Start a new setment
// Draw the Arc //
gctx.arc(center_x,center_y,radious,start_angle*Math.PI,end_angle*Math.PI,false);
// angle to write text part of the data //
var text_angle=start_angle + ( ( end_angle - start_angle) / 2 )
var y1=center_y+ 1.1*(radious)*Math.sin((text_angle)*Math.PI);
var x1=center_x+ 1.1*(radious)*Math.cos((text_angle)*Math.PI);
gctx.closePath();
gctx.fillStyle = data[i][2];
gctx.fill();
gctx.font = '12px sans-serif';
gctx.fillStyle='#000000'
gctx.fillText(data[i][1] + ' : ' + data[i][0],x1,y1);
start_angle=end_angle; // start angle for next segment.
}
gctx.stroke();
</script>
This article is written by plus2net.com team.

|