cos()
import math
print(math.cos(1))       # 0.5403023058681398
print(math.cos(0.56))    # 0.8472551110134161
print(math.cos(-0.56))   # 0.8472551110134161
print(math.cos(-1))      # 0.5403023058681398
print(math.cos(0))       # 1.0
print(math.cos(math.pi)) # -1.0Inputs in degree
We can convert radian value to degree and use the sameimport math
in_degree = 90
in_redian = math.radians(in_degree)
print(math.cos(in_redian)) # 6.123233995736766e-17 1 radian = 57.2957914331 degree
1 degree = 0.0174533 radian
1 degree = 0.0174533 radian
Drawing graph of cos()
Using this we will use Matplotlib to generate graph of cos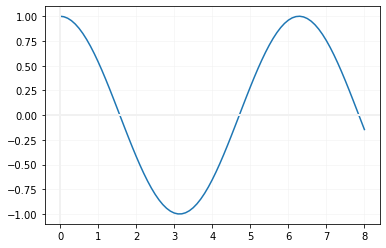
import matplotlib.pyplot as plt
x=[]
y=[]
i=0
while (i<=8):
    x.append(i)
    y.append(math.cos(i))
    i=i+0.1
plt.plot(x,y)
plt.axvline(x=0.00,linewidth=2, color='#f1f1f1')
plt.axhline(y=0.00,linewidth=2, color='#f1f1f1')
plt.grid(linestyle='-', linewidth=0.5,color='#f1f1f1')
plt.show()Drawing sin and cos curves on Tkinter Canvas

Subhendu Mohapatra
Author
🎥 Join me live on YouTubePassionate about coding and teaching, I publish practical tutorials on PHP, Python, JavaScript, SQL, and web development. My goal is to make learning simple, engaging, and project‑oriented with real examples and source code.
Subscribe to our YouTube Channel here
This article is written by plus2net.com team.
https://www.plus2net.com

 Python Video Tutorials