Python PDF generator
Creating PDF file and adding text line image rectangle and watermark by using Python ReportLab
Installing ReportLab
At your command prompt use this command.pip install reportlabCreate PDF files with dynamic data taken from SQLite database in Colab.
Understanding Canvas

Canvas is like a blank white paper where the x , y coordinates starts from bottom left.
x coordinate increases towards right and y coordinate increases towards up direction.
The bottomup argument switches the coordinate system from bottom left to to top left of the page.
How to create PDF file
 Import canvas from reportlab and we are using my_pdf.pdf as our file name. The option bottomup=0 is the default setting ( top , left ) and by setting the value to 1 we can start our coordinate system from buttom left.
 Change the value of my_path as per your system ( requirement ) .
from reportlab.pdfgen import canvas
my_path='G:\\My drive\\testing\\pypdf2\\my_pdf.pdf'
c = canvas.Canvas(my_path,bottomup=0)
c.drawString(200,200,"Hello World") # write text in page
c.showPage() # saves current page
c.save() # stores the file and close the canvasFont colour and font size
We can manage the font size and font colour. Before using drawString() we can set these values.c.setFont("Helvetica", 20) # font family and size
#c.setFillColorCMYK(.2,.2,0,.39) # font colour as CMYK
#c.setFillColorRGB(0,0,1) # font colour as RGB
#c.setFillColor('lightgreen')#lawngreen, lightblue,lemonchiffon
c.setFillColor('lightblue') #lavendarblush
c.drawString(200,200,"Hello World") # write text in page Font style
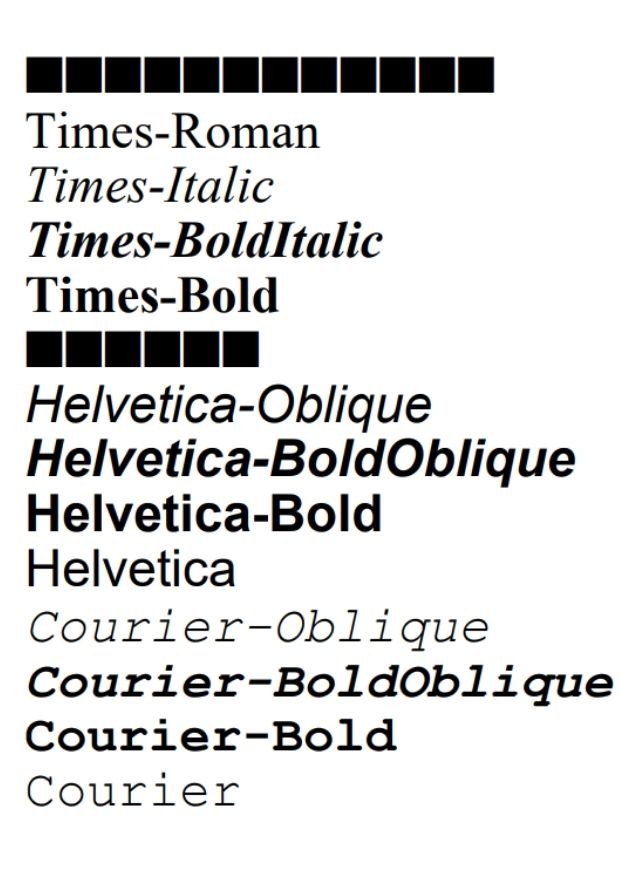
There are some default font family supported by ReportLab. We can get a list of supported fonts by using getAvailableFonts() method. Here is a script to display a list of available fonts.from reportlab.pdfgen import canvas
from reportlab.lib.units import inch
from reportlab.lib.pagesizes import letter
my_path='G:\\My drive\\testing\\pypdf2\\my_pdf.pdf'# file path
c = canvas.Canvas(my_path,pagesize=letter)
c.translate(inch,inch) # starting point of coordinate to one inch
c.setFillColorRGB(0,0,1) # fill colour
l1=c.getAvailableFonts() # list of available fonts
j=1 # to adjust Y coordinate against each row
for my_font in l1: # loop through all fonts
c.setFont(my_font,16) # set font family and size
c.drawString(inch,j*inch*0.5,my_font)
j=j+1
c.showPage() # saves current page
c.save() # stores the file and close the canvas
Installing and working on custom fonts
We will learn how to use Python's ReportLab library to embed and use a custom TrueType font in a PDF document. By handling font files and registering them with ReportLab, we create a PDF that displays text in the specified custom font. This guide covers loading the font, setting it in the PDF canvas, and writing text using the custom font.Adding different font support in Reportlab
Understanding Geometry
We can use various canvas methods like transform, translate, scale, rotate to manage the layout. Here we will start with using the dimension unit inchfrom reportlab.lib.units import inch
from reportlab.lib.pagesizes import letter, A4c.translate(inch,inch) # set the starting point of coordinateDrawing Lines
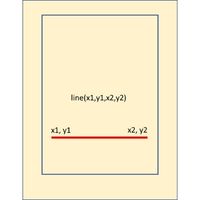
 To draw a line we need two coordinates. x1,y1 and x2,y2.
 Here we are using inch unit.
To set the colour of the line we used setStrokeColurRGB().
We used setLineWidth(10) to set the thickness of the line.
By using translate() we have set the coordinates by keeping one inch as margin.
from reportlab.pdfgen import canvas
from reportlab.lib.units import inch
from reportlab.lib.pagesizes import letter,A4
my_path='G:\\My drive\\testing\\pypdf2\\my_pdf.pdf'# file path
c = canvas.Canvas(my_path,bottomup=1,pagesize=letter)
c.translate(inch,inch) #starting point of coordinate to one inch
c.setStrokeColorRGB(1,0,0) # red colour of line
c.setLineWidth(10) #width of the line
c.line(0,8*inch,7*inch,8*inch) # draw line
c.showPage() # saves current page
c.save() # stores the file and close  the canvas
Drawing Grid
 Instead of using multiple lines we can create grid on our canvas.
from reportlab.pdfgen import canvas
from reportlab.lib.pagesizes import A4
my_path='E:\\testing\\my_pdf\\my_pdf.pdf'# file path
c = canvas.Canvas(my_path,bottomup=1,pagesize=A4)
w,h=A4 # width and height of the page
xlist = [20, 70, 120, 170] # Horizontal coordinates
ylist = [h - 20, h - 70, h - 120, h - 170] # vertical
c.grid(xlist, ylist) # adding grid
c.save() # stores the file and close the canvasc.grid(xlist, ylist)
c.drawString(70,h-70,"plus2net") # write text in page Adding image to PDF file
 We have to specify the x and y coordinates along with the image.
 width and height are optional.
c.drawImage('D:\\top2.jpg',-0.8*inch,9.3*inch)from reportlab.pdfgen import canvas
from reportlab.lib.units import inch
from reportlab.lib.pagesizes import letter,A4
my_path='G:\\My drive\\testing\\pypdf2\\my_pdf.pdf'
c = canvas.Canvas(my_path,bottomup=1,pagesize=letter)
c.translate(inch,inch) #starting point of coordinates
c.drawImage('D:\\top2.jpg',-0.8*inch,9.3*inch)
c.showPage() # saves current page
c.save() # stores the file and close the canvasc.drawImage('https://www.plus2net.com/images/top2.jpg',-0.8*inch,9.3*inch)Rotate
Sometime we have to rotate the text or image on the canvas. Here after rotating the object we can restore by using the same offset.c.rotate(-45)
c.drawImage('D:\\top2.jpg',0,0)
c.rotate(45)Drawing rectangle
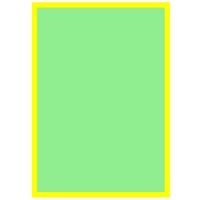
 We can set the width, colour of the border of the rectangle.
c.setLineWidth(10)
c.setStrokeColor('yellow')
c.setFillColor('lightgreen')from reportlab.pdfgen import canvas
from reportlab.lib.units import inch
from reportlab.lib.pagesizes import letter,A4
my_path='G:\\My drive\\testing\\pypdf2\\my_pdf.pdf'# file path
c = canvas.Canvas(my_path,bottomup=1,pagesize=letter)
c.translate(inch,inch) # starting point of coordinate to one inch
c.setLineWidth(10) # width of the border of rectangle
c.setStrokeColor('yellow') # border colour
c.setFillColor('lightgreen') # fill colour
c.rect(1*inch,2*inch,3.5*inch,5*inch,fill=1)
c.showPage() # saves current page
c.save() # stores the file and close the canvasSetting a Custom Page Size in ReportLab
We can define a custom page size by specifying a tuple containing the width and height in points (1 point = 1/72 inch). To set the page size to a width of 595 and a height of 841 points, you can create a custom size like thisfrom reportlab.pdfgen import canvas
from reportlab.lib.units import inch
from reportlab.lib.pagesizes import letter,A4
my_path='E:\\testing\\my_pdf\\my_pdf7.pdf'# file path
# Custom page size: width=595, height=841
custom_size = (595, 841)
c = canvas.Canvas(my_path,bottomup=1,pagesize=custom_size)
c.translate(inch,inch) # starting point of coordinate to one inch
c.setLineWidth(10) # width of the border of rectangle
c.setStrokeColor('yellow') # border colour
c.setFillColor('lightgreen') # fill colour
c.rect(1*inch,2*inch,3.5*inch,5*inch,fill=1)
c.showPage() # saves current page
c.save() # stores the file and close the canvaswatermark pdf document
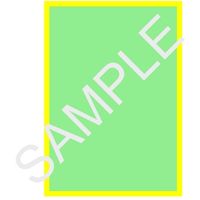
 We can use text to place watermark over the PDF document.
 Here the font colour of the text will make it light gray by using CMYK colour values. Increase the last value if you want more dark colour.
c.rotate(45) # rotate by 45 degree
# font colour CYAN, MAGENTA, YELLOW and BLACK
c.setFillColorCMYK(0,0,0,0.08) # colour values
c.setFont("Helvetica", 100) # font style and size
c.drawString(2*inch, 1*inch, "SAMPLE") # String written
c.rotate(-45) # restore the rotation from reportlab.pdfgen import canvas
from reportlab.lib.units import inch
from reportlab.lib.pagesizes import letter,A4
my_path='G:\\My drive\\testing\\pypdf2\\my_pdf.pdf'# file path
c = canvas.Canvas(my_path,bottomup=1,pagesize=letter)
c.translate(inch,inch) # starting point of coordinate to one inch
c.setLineWidth(10) # width of the border of rectangle
c.setStrokeColor('yellow') # border colour
c.setFillColor('lightgreen') # fill colour
c.rect(1*inch,2*inch,3.5*inch,5*inch,fill=1)
#start watermark
c.rotate(45) # rotate by 45 degree
# font colour CYAN, MAGENTA, YELLOW and BLACK
c.setFillColorCMYK(0,0,0,0.08) # colour values
c.setFont("Helvetica", 100) # font style and size
c.drawString(2*inch, 1*inch, "SAMPLE") # String written
c.rotate(-45) # restore the rotation
c.setFont("Helvetica", 10)
c.setFillColorRGB(1,0,0) # font colour
c.drawString(0, -0.9*inch, u"\u00A9"+" plus2net.com")
c.showPage() # saves current page
c.save() # stores the file and close the canvasPDF Standard Templates
We use letter pads as common template to use for any letter or bill. Using the above concepts we will prepare one standard Letter head and use them to add more text to tour pdf document.Here are two files main.py will create the pdf document by using template from temp1.py file.
main.py
temp1.py
Password protected PDF file
from reportlab.pdfgen import canvas
from reportlab.lib import pdfencrypt

pw=pdfencrypt.StandardEncryption('test') # password is test

my_path='D:\\testing\\my_pdf\\my_pdf.pdf'# file path
c = canvas.Canvas(my_path,bottomup=0,encrypt=pw)
c.drawString(200,200,'Hello world')
c.showPage()
c.save()
I have created a comprehensive YouTube playlist on how to use ReportLab to create PDF documents in Python. This playlist includes detailed tutorials that cover a wide range of topics, from basic PDF creation to advanced features and customizations. Whether you are a beginner or an experienced developer, these videos will guide you through the process of generating professional-quality PDFs programmatically. Check out the playlist here:
ReportLab PDF Creation in Python.
ReportLab PDF Creation in Python.
Multiple PDF files each with unique password consists of combination of name and birth month
Adding different font support in Reportlab
Creating PDF Documents with Grid and 2D List Data
PDF Mark sheet by using data from SQLite database Generate PDF Invoice using Sales data Table from different data sources to PDF file Table from Pandas DataFrame to PDF file PDF Circles & Shapes
Create Report in PDF using Charts, images, tables and Paragraphs
PDF Id-card ID card from user Inputs in Tkinter
Bar charts in PDF Line charts in PDF Pie Charts Paragraph
Python

Subhendu Mohapatra
Author
🎥 Join me live on YouTubePassionate about coding and teaching, I publish practical tutorials on PHP, Python, JavaScript, SQL, and web development. My goal is to make learning simple, engaging, and project‑oriented with real examples and source code.
Subscribe to our YouTube Channel here
This article is written by plus2net.com team.
https://www.plus2net.com

 Python Video Tutorials