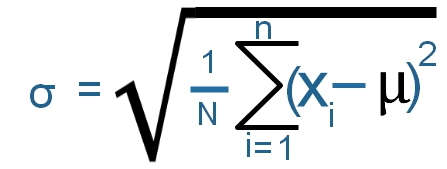
Standard Deviation σ

- Find out the average value (μ ) of the numbers or the list
- Find out the sum (Σ) of square of difference between number and average value
- Divide the sum by number of elements ( N )
- Take the square root of the above division
Note that this is Population Standard Deviation
import math
list1=[12,13,15,11,9,12,13,10,11,12,13,7,8]
def my_stddev(my_list):
    my_sum=0
    for i in my_list:
        my_sum=my_sum+i
    #print(my_sum)
    print("Sum :",my_sum)
    my_no=len(my_list)

    my_avg=my_sum/my_no
    print("Average",my_avg)
    sum_avg=0.0
    for i in my_list:
        sum_avg=sum_avg+math.pow((i-my_avg),2)
    my_variance = sum_avg/my_no
    print("Variance :",my_variance )
    std=math.sqrt(my_variance)
    return std

print("Standard Deviation",my_stddev(list1))Sum : 146
Average 11.23076923076923
Variance : 4.6390532544378695
Standard Deviation 2.1538461538461537Using Pandas
Read more on Pandas here. We can use ddof option to tell Delta Degrees of Freedom. Default value of ddof is 1. The code with output is here.list1=[12,13,15,11,9,12,13,10,11,12,13,7,8]
my_dict={'l1':list1}
my_data = pd.DataFrame(data=my_dict)
print(my_data['l1'].std(ddof=0)) # 2.1538461538461537
print(my_data['l1'].std(ddof=1)) # 2.24179415327122ddof=0 in Pandas std() function.
Using Numpy
Read more on Numpy here. There is a built in standar deviation function in Numpy.import numpy as np
my_data=np.array(list1)
print(my_data.std(ddof=0)) # 2.153846153846154
print(my_data.std(ddof=1)) # 2.2417941532712202ddof=0
Using statistics
We will use the statistics libraryimport statistics
print("Standard Deviation : ",statistics.stdev(list1))Standard Deviation : 2.24179415327122
Subhendu Mohapatra
Author
🎥 Join me live on YouTubePassionate about coding and teaching, I publish practical tutorials on PHP, Python, JavaScript, SQL, and web development. My goal is to make learning simple, engaging, and project‑oriented with real examples and source code.
Subscribe to our YouTube Channel here
This article is written by plus2net.com team.
https://www.plus2net.com

 Python Video Tutorials