Pandas count(): Count Known Values and Check Completeness
Use count() to count non-missing values in each Pandas column or row. Compare it with the total number of records to measure completeness, and use a Boolean sum when you want to count matches to a condition.
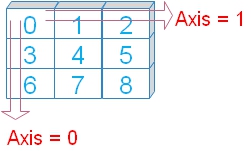
Count known values in the student table 🔝
count() counts non-missing cells, not necessarily total rows. With complete data, every column count equals the row count. The student dataset offers additional practice.
import pandas as pd
import numpy as np

def student_data():
    return pd.DataFrame({
        "NAME": ["Ravi", "Raju", "Alex", "Ron", "King", "Jack"],
        "ID": [1, 2, 3, 4, 5, 6],
        "MATH": [80, 40, 70, 70, 70, 30],
        "ENGLISH": [80, 70, 40, 50, 60, 30]
    })

df = student_data()
print(df.count())
assert df.count().eq(6).all()
Expected output
NAME       6
ID         6
MATH       6
ENGLISH    6
dtype: int64
Count down rows with axis=0 🔝
The default axis=0 returns a result for each column. axis="index" is its named equivalent.
df = student_data()
print(df.count(axis=0))
assert df.count(axis=0).equals(df.count(axis="index"))
Expected output
NAME       6
ID         6
MATH       6
ENGLISH    6
dtype: int64
Count across columns with axis=1 🔝
axis=1 returns the number of non-missing cells per row. A complete row here has four values. Select score columns if the count should describe subject availability rather than IDs and names.
df = student_data()
print("All fields:")
print(df.count(axis=1))
print("Scores only:")
print(df[["MATH", "ENGLISH"]].count(axis=1))
assert df.count(axis=1).eq(4).all()
Expected output
All fields:
0    4
1    4
2    4
3    4
4    4
5    4
dtype: int64
Scores only:
0    2
1    2
2    2
3    2
4    2
5    2
dtype: int64
See how a missing score changes counts 🔝
Alex has three known fields but only one known score. None, NaN, pd.NA and NaT are missing-value representations excluded from count(). Zero is a known value.
df = student_data()
df.loc[2, "ENGLISH"] = np.nan
print("By row:")
print(df.count(axis=1))
print("By column:")
print(df.count())
assert df.loc[2].count() == 3
assert df["ENGLISH"].count() == 5
Expected output
By row:
0    4
1    4
2    3
3    4
4    4
5    4
dtype: int64
By column:
NAME       6
ID         6
MATH       6
ENGLISH    5
dtype: int64
Compare count(), len(), shape and size 🔝
len(df) and shape[0] count all rows. shape[1] counts columns. size counts all cell positions, including missing ones. count().sum() counts the known cells across the table.
df = student_data()
df.loc[2, "ENGLISH"] = np.nan
print("Rows:", len(df))
print("Shape:", df.shape)
print("All cells:", df.size)
print("Known cells:", df.count().sum())
assert df.size == 24 and df.count().sum() == 23
Expected output
Rows: 6
Shape: (6, 4)
All cells: 24
Known cells: 23
Use numeric_only deliberately 🔝
numeric_only=True includes numeric and Boolean columns. It excludes the name column but still includes ID. For meaningful measurement completeness, explicitly select the intended fields. See select_dtypes() and dtypes.
df = student_data()
df["submitted"] = [True, False, True, True, False, True]
print(df.count(numeric_only=True))
print("Subject counts:")
print(df[["MATH", "ENGLISH"]].count())
assert "NAME" not in df.count(numeric_only=True).index
assert df["submitted"].count() == 6
Expected output
ID           6
MATH         6
ENGLISH      6
submitted    6
dtype: int64
Subject counts:
MATH       6
ENGLISH    6
dtype: int64
Count MultiIndex groups with groupby(level=...) 🔝
The current count() API has no level parameter. Group by the index level instead. A group exists for Alex even though the English count is zero.
df = student_data()
df.loc[2, "ENGLISH"] = np.nan
indexed = df.set_index(["NAME", "ID"])
result = indexed.groupby(level="NAME").count()
print(result)
assert result.loc["Alex", "MATH"] == 1
assert result.loc["Alex", "ENGLISH"] == 0
Expected output
      MATH  ENGLISH
NAME
Alex     1        0
Jack     1        1
King     1        1
Raju     1        1
Ravi     1        1
Ron      1        1
Compare grouped count with grouped size 🔝
Group size counts rows, while a selected column count counts known values in that field. By default, rows with missing grouping keys are excluded; dropna=False includes a missing-key group.
orders = pd.DataFrame({"region": ["North", "North", "South", None], "amount": [10, None, 0, 5]})
summary = orders.groupby("region", dropna=False).agg(rows=("amount", "size"), known_amounts=("amount", "count"))
print(summary)
assert summary.loc["North", "rows"] == 2
assert summary.loc["North", "known_amounts"] == 1
Expected output
        rows  known_amounts
region
North      2              1
South      1              1
NaN        1              1
Count matches with a Boolean sum 🔝
count() on a complete Boolean mask counts both True and False. sum() counts True values. For text conditions, use str.contains() with an explicit missing-value policy.
df = student_data()
passed = df["MATH"].ge(60)
print("Known Boolean values:", passed.count())
print("Passing students:", passed.sum())
assert passed.count() == 6 and passed.sum() == 4
Expected output
Known Boolean values: 6
Passing students: 4
Count distinct values rather than observations 🔝
count() does not remove repeated values. nunique() counts distinct values, excluding missing values by default. Deduplicate records only when the entity and duplicate key are defined; see drop_duplicates().
names = pd.Series(["Alex", "Alex", "Ravi", None], dtype="string")
print("Known observations:", names.count())
print("Distinct known names:", names.nunique())
print("Distinct including missing:", names.nunique(dropna=False))
assert names.count() == 3 and names.nunique() == 2
Expected output
Known observations: 3
Distinct known names: 2
Distinct including missing: 3
Normalize blanks before counting completeness 🔝
Empty strings and whitespace count as known values until they are normalized to missing. A known zero amount must not be erased by this text-cleaning rule. See text cleaning.
raw = pd.Series(["Alex", "", "   ", None], dtype="string")
clean = raw.str.strip().replace("", pd.NA)
print("Before:", raw.count())
print("After:", clean.count())
assert raw.count() == 3 and clean.count() == 1
Expected output
Before: 3
After: 1
Practical workflow: inspect sales completeness 🔝
This synthetic sales extract contains missing customers, an unknown amount and a genuine zero. Measure completeness before selecting a dropna() or fillna() policy. Counting known cells cannot detect incorrect values.
sales = pd.DataFrame({
    "order_id": [101, 102, 103, 104],
    "customer": ["Alex", "", None, "Ravi"],
    "amount": [12.5, 20, None, 0]
})
sales["customer"] = sales["customer"].astype("string").str.strip().replace("", pd.NA)
audit = pd.DataFrame({"known": sales.count(), "missing": sales.isna().sum()})
audit["complete_percent"] = sales.notna().mean().mul(100).round(1)
print(audit)
assert audit.loc["amount", "known"] == 3
assert audit.loc["customer", "complete_percent"] == 50
Expected output
          known  missing  complete_percent
order_id      4        0             100.0
customer      2        2              50.0
amount        3        1              75.0
Count complete records across required fields 🔝
An order ID and amount are required for this report; the customer is optional. Count the selected known fields per row and compare with the number of requirements. Report retained and incomplete rows separately.
required = ["order_id", "amount"]
known_fields = sales[required].count(axis=1)
complete = known_fields.eq(len(required))
print("Complete orders:", complete.sum())
print("Incomplete orders:", (~complete).sum())
print(sales.loc[complete])
assert complete.sum() == 3
Expected output
Complete orders: 3
Incomplete orders: 1
   order_id customer  amount
0       101     Alex    12.5
1       102     <NA>    20.0
3       104     Ravi     0.0
Handle empty tables and percentages safely 🔝
A zero-row table has no observations. Its completeness percentage should remain undefined unless a reporting policy specifies otherwise. Do not divide by zero or label an empty dataset as 100 percent complete.
empty = pd.DataFrame({"amount": pd.Series(dtype="float64")})
print("Known values:", empty["amount"].count())
percent = empty["amount"].count() / len(empty) * 100 if len(empty) else np.nan
print("Completeness percent:", percent)
assert pd.isna(percent)
Expected output
Known values: 0
Completeness percent: nan
Common questions and mistakes 🔝
Why is count less than the row count? That field contains missing values. Does False count? Yes, as does zero. Does blank text count? Yes, unless normalized to missing. Why does level fail? Use groupby(level=...).count(). How do I count matching rows? Sum a Boolean mask. Does count measure validity? No; validate ranges, formats and identifiers separately. Inspect the table with info() and columns.
Exercise: count available scores and passing results 🔝
Create student IDs 1, 2, 3 and 4 with scores 70, missing, 0 and 55. Report total students, available scores, missing scores and scores at least 60. Expect 4, 3, 1 and 1 respectively.
Exercise solution 🔝
Zero is an available score, but not a passing score. The missing-score policy is explicit when counting passes.
students = pd.DataFrame({"id": [1, 2, 3, 4], "score": pd.Series([70, None, 0, 55], dtype="Int64")})
print("Students:", len(students))
print("Available scores:", students["score"].count())
print("Missing scores:", students["score"].isna().sum())
passing = students["score"].ge(60).fillna(False)
print("Passing:", passing.sum())
assert students["score"].count() == 3 and passing.sum() == 1
Expected output
Students: 4
Available scores: 3
Missing scores: 1
Passing: 1
Practice in Google Colab 🔝
Open in Google Colab View on GitHub
Run the examples in order, change missing values and compare row counts, known values and condition counts. Save your own copy to keep edits. All sample tables are included in the notebook.
Continue with data exploration and analysis, row filtering and plotting.
Reference: Pandas DataFrame.count documentation.

Subhendu Mohapatra
Author & Instructor at plus2net
I write and maintain practical tutorials on Python, PHP, SQL, JavaScript, HTML, jQuery, and web development at plus2net. The tutorials focus on clear explanations, working examples, and code that readers can test and adapt while learning.


Subscribe to our YouTube Channel here

 Python Video Tutorials