Exercise : Reports on Sales data
We have three CSV files.
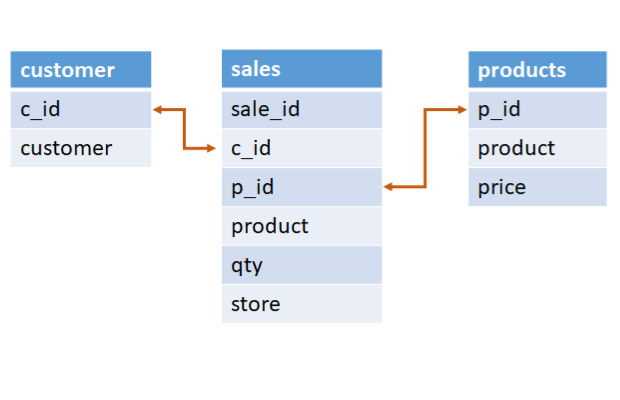
customer.csv : Two columns, customer id and customer name
products.csv : Three columns ,p_id( product id) , product ( name) and price
sales.csv Six columns , sale_id, c_id ( customer id ), p_id (product_id), qty ( quantity sold) ,store ( name )
Sample data is kept inside the csv files, click the csv file name to download.
Download sample DataFrame for Sales, Product and Customer
From the above data we will produce following reports.
- Exercise on Pandas DataFrame
- List of products sold
- List of quantity sold against each product.
- List of quantity and total sales against each product
- List of quantity sold against each product and against each store.
- List of quantity sold against each Store with total turnover of the store.
- List of products which are not sold
- List of customers who have not purchased any product.
In all the sample codes below if you are using the sample DataFrames of three tables then reading from CSV file is not required. List of products sold
List of products sold
Our sales table will have list of products sold.import pandas as pd
sales=pd.read_csv("sales.csv") # reading from csv file
print(sales) sale_id c_id p_id product qty store
0 1 2 3 Monitor 2 ABC
1 2 2 4 CPU 1 DEF
2 3 1 3 Monitor 3 ABC
3 4 4 2 RAM 2 DEF
4 5 2 3 Monitor 3 ABC
5 6 3 3 Monitor 2 DEF
6 7 2 2 RAM 3 ABC
7 8 3 2 RAM 2 DEF
8 9 2 3 Monitor 2 ABC2. List of quantity sold against each products
We will use groupby to count total sale against each product.print(sales.groupby(['product','p_id'])[['qty']].sum()) qty
product p_id
CPU 4 1
Monitor 3 12
RAM 2 73. List of quantity and total sales against each product
You can un-comment the print commands and check the intermediate results. We used merge to join two DataFrames and to get Product details ( price of the product ).We added one more column total_sales by multiplying total sales with price.
import pandas as pd
sales=pd.read_csv("sales.csv")
#print(sales)
# using groupby get the list of products and its sum sold
my_sale=sales.groupby(['product','p_id', 'store'])[['qty']].sum()
#print(my_sale)
product=pd.read_csv("products.csv")
#print(product)
my_sum=pd.merge(my_sale,product,how='left',on='p_id')
#print(my_sum)
#We added one more column total_sales by multiplying total sales with price.
my_sum['total_sale']=my_sum['qty']*my_sum['price']
print(my_sum) p_id qty product price total_sale
0 4 1 CPU 55 55
1 3 10 Monitor 75 750
2 3 2 Monitor 75 150
3 2 3 RAM 90 270
4 2 4 RAM 90 360my_sale=sales.groupby(['product','p_id', 'store'])[['qty']].sum().reset_index() product_x p_id store qty product_y price total_sale
0 CPU 4 DEF 1 CPU 55 55
1 Monitor 3 ABC 10 Monitor 75 750
2 Monitor 3 DEF 2 Monitor 75 150
3 RAM 2 ABC 3 RAM 90 270
4 RAM 2 DEF 4 RAM 90 3604. List of quantity sold against each product and against each store.
import pandas as pd
sales=pd.read_csv("sales.csv")
print(sales.groupby(['product','p_id','store'])[['qty']].sum()) qty
product p_id store
CPU 4 DEF 1
Monitor 3 ABC 10
DEF 2
RAM 2 ABC 3
DEF 45. List of quantity sold against each Store with total turnover of the store.
We will first find out the total price ( or turnover ) against each sale by multiplying quantity sold with price of each unit.To get price of each unit ( which is in product dataframe ) we have to merge sales with product DataFrame using product id ( p_id ).
Once we get the total turnover against each sale, we will use groupby method to find out total sales ( turnover ) and quantity against each store.
import pandas as pd
sales=pd.read_csv("sales.csv")
#print(sales)
product=pd.read_csv("products.csv")
my_sum=pd.merge(sales,product,how='left',on=['p_id'])
my_sum['sales_total']=my_sum['qty']*my_sum['price']
print(my_sum.groupby(['store'])[['qty','sales_total']].sum()) qty sales_total
store
ABC 13 1020
DEF 7 5656.List of products which are not sold
Read more on isnull() here.import pandas as pd
products=pd.read_csv("products.csv")
sales=pd.read_csv("sales.csv")
my_data=pd.merge(sales,products,on='p_id',how='right')
#print(my_data['sale_id'].isna())
my_data=my_data[my_data['sale_id'].isnull()] # products which are not sold
print(my_data)
#print(my_data.loc[:,'product_y']) # to display only produts column sale_id c_id p_id product_x qty store product_y price
9 NaN NaN 1 NaN NaN NaN Hard Disk 80
10 NaN NaN 5 NaN NaN NaN Keyboard 20
11 NaN NaN 6 NaN NaN NaN Mouse 10
12 NaN NaN 7 NaN NaN NaN Motherboard 50
13 NaN NaN 8 NaN NaN NaN Power supply 207.List of customers who have not purchased any product.
import pandas as pd
sales=pd.read_csv("sales.csv")
customer=pd.read_csv("customer.csv")
my_data=pd.merge(sales,customer,on='c_id',how='right')
my_data=my_data[my_data['sale_id'].isnull()] # products which are not sold
#print(my_data)
print(my_data.loc[:,'Customer']) # to display customers who has not purchased 9 King
10 Ronn
11 Jem
12 Tom
Name: Customer, dtype: object
Subhendu Mohapatra
Author
🎥 Join me live on YouTubePassionate about coding and teaching, I publish practical tutorials on PHP, Python, JavaScript, SQL, and web development. My goal is to make learning simple, engaging, and project‑oriented with real examples and source code.
Subscribe to our YouTube Channel here
This article is written by plus2net.com team.
https://www.plus2net.com

 Python Video Tutorials