Pandas DataFrame mean()
DataFrame.mean(self, axis=None, skipna=None, level=None, numeric_only=None)self | array, elements to get the mean value |
axis | Int (optional ), or tuple, default is None, mean among all the elements. If axis given then values across the axis is returned. |
level | int ( Optional ),default is None, for multiindex Axis. count along the level. |
skipna | Bool ( Optional ),default is True, Exclude NA values. |
numeric_only | Bool ( Optional ),default is None, include only Int, floot and boolean columns. |
import pandas as pd
my_dict={'NAME':['Ravi','Raju','Alex','Ron','King','Jack'],
         'ID':[1,2,3,4,5,6],
         'MATH':[80,40,70,70,70,30],
         'ENGLISH':[80,70,40,50,60,30]}
my_data = pd.DataFrame(data=my_dict)
print(my_data.mean())ID 3.5
MATH 60.0
ENGLISH 55.0
dtype: float64print(my_data['MATH'].mean()) # 60.0 print(my_data[my_data['MATH']<=my_data['MATH'].mean()]) NAME ID MATH ENGLISH
1 Raju 2 40 70
5 Jack 6 30 30Using axis
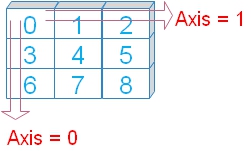 We will use option axis=1 by adding to above code.
( The last line is only changed )
print(my_data.mean(axis=1))0 53.666667
1 37.333333
2 37.666667
3 41.333333
4 45.000000
5 22.000000
dtype: float64axis=0 ( default ) is same as output shown at starting of this page.
level option
For MultiIndex (hierarchical) axis we can specify the level.import pandas as pd
my_dict=pd.MultiIndex.from_arrays(
[[1,2,3,4,5,6],
[80,40,70,70,70,30],
[80,70,40,50,60,30]],
names=['id','math','eng'])
my_data = pd.Series([4, 2, 0, 8,3,4], name='marks', index=my_dict)
print(my_data.mean(level='math'))math
80 4.000000
40 2.000000
70 3.666667
30 4.000000
Name: marks, dtype: float64Handling NA data using skipna option
We will use skipna=True to ignore the null or NA data. Let us check what happens if it is set to True ( skipna=True )import numpy as np
import pandas as pd
my_dict={'NAME':['Ravi','Raju','Alex','Ron','King','Jack'],
'ID':[1,2,3,4,5,6],
'MATH':[80,40,70,70,70,30],
'ENGLISH':[80,70,np.nan,50,60,30]}
my_data = pd.DataFrame(data=my_dict)
print(my_data.mean(skipna=True))ID 3.5
MATH 60.0
ENGLISH 58.0
dtype: float64skipna=False
print(my_data.mean(skipna=False))ID 3.5
MATH 60.0
ENGLISH NaN
dtype: float64numeric_only
Default value is None, we can set it to True ( numeric_only=True ) to include only float, int, boolean columns. We can included all by setting it to False ( numeric_only=False ) . Let us see the outputs .print(my_data.mean(numeric_only=False))TypeError: could not convert string to float: 'RaviRajuAlexRonKingJack'
Pandas Plotting graphs max min sum len std Filtering of Data

Subhendu Mohapatra
Author
🎥 Join me live on YouTubePassionate about coding and teaching, I publish practical tutorials on PHP, Python, JavaScript, SQL, and web development. My goal is to make learning simple, engaging, and project‑oriented with real examples and source code.
Subscribe to our YouTube Channel here
This article is written by plus2net.com team.
https://www.plus2net.com

 Python Video Tutorials