Pandas DataFrame Plot barh graph
Python Pandas Plot horizontal or vertical Bar graph by using DataFrame with options & save as image
Pandas.DataFrame.plot to get bar graphs using data
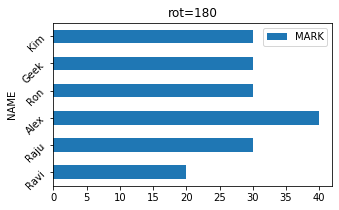
Let us create a DataFrame with name of the students and their marks.

import pandas as pd
my_dict={
'NAME':['Ravi','Raju','Alex',
        'Ron','Geek','Kim'],
'MARK':[20,30,40,30,30,30]
}
df = pd.DataFrame(data=my_dict)
df.plot.barh(title="rot=180",x='NAME',
        y='MARK',figsize=(5,3),rot=45)
Bar Graph with options
There are several options we can add to above bar graph and they are same as plot.bar. So read the options of bar graph.Pandas plot Bar Graph plot.bar()

Subhendu Mohapatra
Author
🎥 Join me live on YouTubePassionate about coding and teaching, I publish practical tutorials on PHP, Python, JavaScript, SQL, and web development. My goal is to make learning simple, engaging, and project‑oriented with real examples and source code.
Subscribe to our YouTube Channel here
This article is written by plus2net.com team.
https://www.plus2net.com

 Python Video Tutorials