Pandas DataFrame Plot boxplot graph
Box plot display summary of five that is minimum, first quartile, median, third quartile and maximum.
The box is drawn between first and third quartile.
Median is drawn within the box.
Let us try one example. Here we have sample data for two subjects.

import pandas as pd
my_dict={
'MATH':[30,33,32,32,31,34,32],
'ENG':[32,31,35,34,35,34,32]
}
df = pd.DataFrame(data=my_dict)
df.boxplot(figsize=(5,3),grid=True)
boxplot with options
There are several options we can add to above boxplot.return_type
Default type is 'axis', we can set it to return_type='dict' , return_type='axes' or return_type='both'.grid
We will show grid ( grid=True ) or not ( grid=False)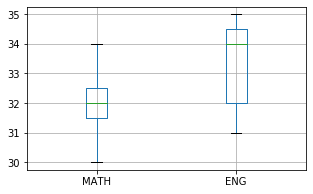
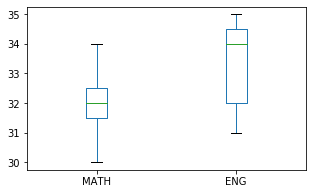
df.boxplot(grid=False,figsize=(5,3))column
If your source file has more columns and you want to specify the column to use.df.boxplot(column='Open Price',figsize=(10,4),grid=True)df.boxplot(column=['Close Price','Open Price'],grid=True)figsize :
Size of the graph , it is a tuple saying width and height in inches, figsize=(6,3). Here width is 6 inches and height is 3 inches.df.boxplot(figsize=(5,3))rot
rot=45 Rotation of x axis labels in degree.Rotation of ticks ( check the names at x axis )
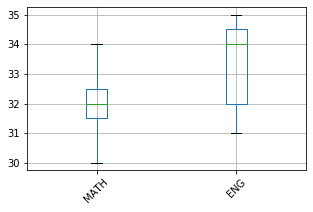
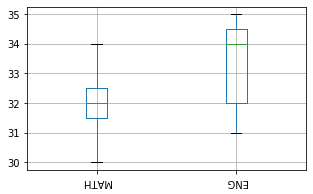
df.boxplot(figsize=(5,3),rot=180)fontsize
fontsize=20 , we can set the font size used labels in x and y axis.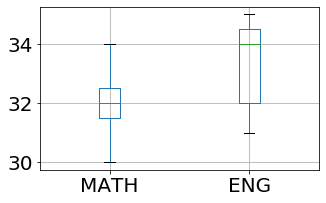
df.boxplot(figsize=(5,3),fontsize=20)Pandas plot plot.barh()

Subhendu Mohapatra
Author
🎥 Join me live on YouTubePassionate about coding and teaching, I publish practical tutorials on PHP, Python, JavaScript, SQL, and web development. My goal is to make learning simple, engaging, and project‑oriented with real examples and source code.
Subscribe to our YouTube Channel here
This article is written by plus2net.com team.
https://www.plus2net.com

 Python Video Tutorials