Graphs using MySQL data & DataFrame
There are three steps in reading data and displaying graph.
- Connect to MySQL Database
- Get Data using Query and Create DataFrame
- Plotting of Graph
Connect to MySQL Database
Using SQLAlchemy we will connect to MySQL database, replace your userid , password and database name ( db_name ) .from sqlalchemy import create_engine
my_conn = create_engine("mysql+mysqldb://userid:password@localhost/db_name")Get Data using Query and Create DataFrame
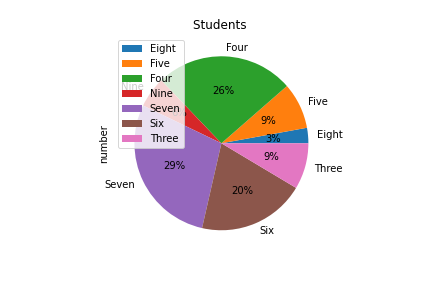
SQL query is the first step to get data from MySQL database. This query can be changed to get different type / form of data. We used read_sql() to create the DataFrame using returned data from MySQL table.query="SELECT class,COUNT( * ) number FROM student GROUP BY class"
df = pd.read_sql(query,my_conn)
lb= [row for row in df['class']] # Labels of graphPlotting of Graph
plot=df.plot.pie(title="Students",y='number',
labels=lb,autopct='%1.0f%%')import pandas as pd # import Pandas library
from sqlalchemy import create_engine
my_conn = create_engine("mysql+mysqldb://usrid:password@localhost/my_db")
query="SELECT class,COUNT( * ) number FROM student GROUP BY class"
df = pd.read_sql(query,my_conn)
lb= [row for row in df['class']] # Labels of graph
plot=df.plot.pie(title="Students ",y='number',labels=lb,autopct='%1.0f%%')Using Bar graph
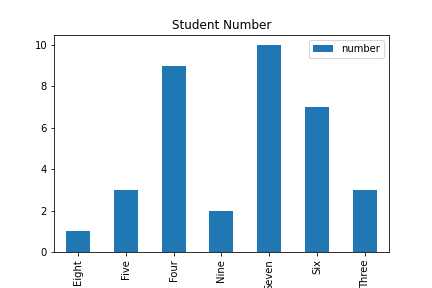
Connection to MySQL and query execution remain same as above code, only the last line is changed to generate the bar graph.
import pandas as pd
from sqlalchemy import create_engine
my_conn = create_engine("mysql+mysqldb://root:test@localhost/my_tutorial")
query="SELECT class,COUNT(*) number FROM student GROUP BY class"
df = pd.read_sql(query,my_conn)
plot=df.plot.bar(title="Student Number",x='class');Horizontal Bar graph
We will plot one Horizontal bar graph by changing the last line only.plot=df.plot.barh(title="Student Number",x='class');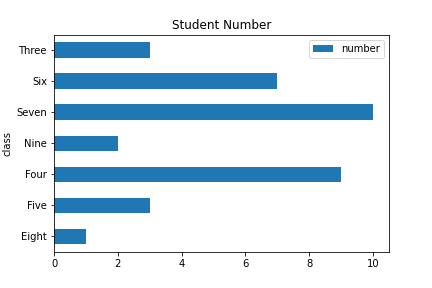
HBar graph
More than one value in Bar graph
In above code we kept two columns, now we will use three columns. One columns class we will use in y axis, other two columns maximum mark ( max ) and average value ( avg ) will be used to draw the graphs.Note that only the Query part is changed ( from above code ) here and the DataFrame is having one more column data
import pandas as pd # import Pandas library
from sqlalchemy import create_engine
my_conn = create_engine("mysql+mysqldb://root:test@localhost/my_tutorial")
query="SELECT class,MAX(mark) max, AVG(mark) avg FROM student GROUP BY class"
df = pd.read_sql(query,my_conn)
plot=df.plot.bar(title="Student Number",x='class');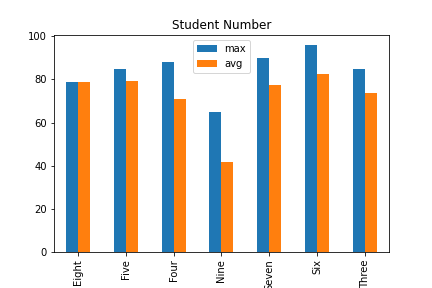
Stacked Bar Graph
We will break the number of students in two parts based on gender ( male , female ) and create stacked bar graph ( Note the option stacked=True ). Query is also changed to include GROUP BY and CASE.import pandas as pd # import Pandas library
from sqlalchemy import create_engine
my_conn = create_engine("mysql+mysqldb://root:test@localhost/my_tutorial")
query="SELECT class,\
sum(CASE WHEN gender ='male' THEN 1 ELSE 0 END) as Male,\
sum(CASE WHEN gender ='Female' THEN 1 ELSE 0 END) as Female\
FROM student group by class"
df = pd.read_sql(query,my_conn)
plot=df.plot.bar(title="Student Number",x='class',stacked=True);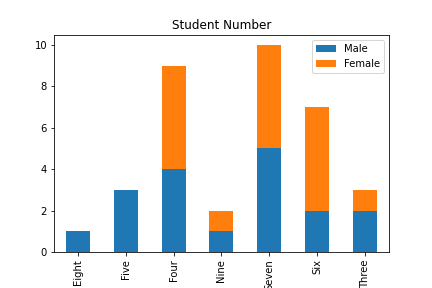
Using Line Graph
Only the last line is changed ( from the above code given for simple bar graph) .plot=df.plot.line(title="Student Number",x='class',y='number')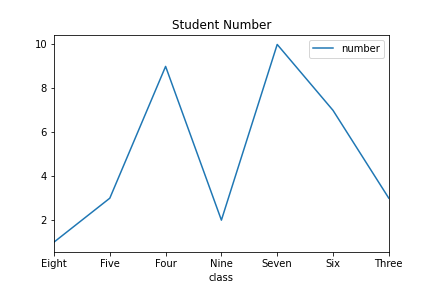
Line Plot
Density graph
Using mark column we will create density graph. The query and drawing graph is only shown here as the library and connection string is same as given above.query="SELECT mark FROM student"
df = pd.read_sql(query,my_conn)
plot=df.plot.density();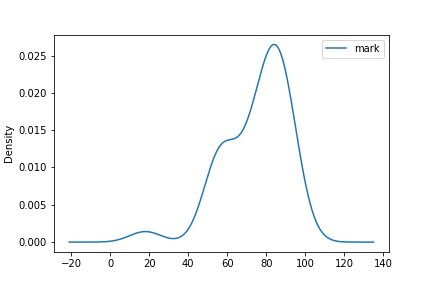
Density
Scatter graph
Two numeric columns are used for this graph.query="SELECT COUNT( * ) number,avg(mark) avg FROM student GROUP BY class"
df = pd.read_sql(query,my_conn)
plot=df.plot.scatter(title="Average Vs Number ",x='avg',y='number')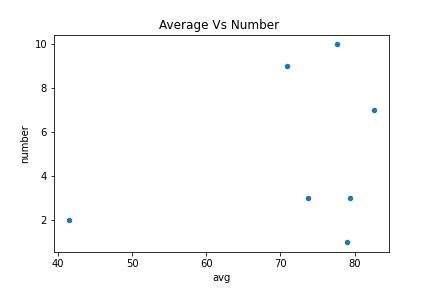
Scatter
Saving graph as image
plot=df.plot.pie(title="Students",y='number',
labels=lb,autopct='%1.0f%%')
fig = plot.get_figure()
fig.savefig("D:\\my_data\\output2.png")
Subhendu Mohapatra
Author
🎥 Join me live on YouTubePassionate about coding and teaching, I publish practical tutorials on PHP, Python, JavaScript, SQL, and web development. My goal is to make learning simple, engaging, and project‑oriented with real examples and source code.
Subscribe to our YouTube Channel here
This article is written by plus2net.com team.
https://www.plus2net.com

 Python Video Tutorials