Pandas sum(): Row, Column and Grouped Totals
sum() adds values over a chosen axis. Use it for column totals, a combined score per row or category subtotals. Select the fields that belong together, then decide how missing values should affect the result. A subtotal of known values is useful, but it should not be mistaken for a complete total.
| Question | Approach |
|---|---|
| Total for each selected column | sum(axis=0) |
| Total across selected columns per row | sum(axis=1) |
| Require at least one known value | sum(min_count=1) |
| Propagate any missing value | sum(skipna=False) |
| Total by category | groupby(...).sum() |
Create the Student DataFrame
The table contains student names, an ID and two subject scores. Select the scores explicitly when calculating marks: an ID is numeric but is not a score. The student sample-data page provides a larger dataset for further practice.
import pandas as pd

def student_data():
    return pd.DataFrame({
        "NAME": ["Ravi", "Raju", "Alex", "Ron", "King", "Jack"],
        "ID": [1, 2, 3, 4, 5, 6],
        "MATH": [80, 40, 70, 70, 70, 30],
        "ENGLISH": [80, 70, 40, 50, 60, 30]
    })

df = student_data()
print(df)
Expected output
   NAME  ID  MATH  ENGLISH
0  Ravi   1    80       80
1  Raju   2    40       70
2  Alex   3    70       40
3   Ron   4    70       50
4  King   5    70       60
5  Jack   6    30       30
Sum Columns with axis=0
The default axis=0 adds values down the rows and returns one result per selected column. MATH totals 360 and ENGLISH totals 330. It sums values; it does not count the number of rows or columns.
df = student_data()
totals = df[["MATH", "ENGLISH"]].sum(axis=0)
print(totals)
assert totals.to_dict() == {"MATH": 360, "ENGLISH": 330}
Expected output
MATH       360
ENGLISH    330
dtype: int64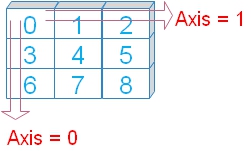
Sum Across Columns with axis=1
axis=1 adds the selected columns within each row. Use this for each student's combined score. Select columns with compatible units; adding IDs, ages and marks would not produce a meaningful total.
df = student_data()
df["TOTAL"] = df[["MATH", "ENGLISH"]].sum(axis=1)
print(df[["NAME", "MATH", "ENGLISH", "TOTAL"]])
assert df["TOTAL"].tolist() == [160, 110, 110, 120, 130, 60]
Expected output
   NAME  MATH  ENGLISH  TOTAL
0  Ravi    80       80    160
1  Raju    40       70    110
2  Alex    70       40    110
3   Ron    70       50    120
4  King    70       60    130
5  Jack    30       30     60
numeric_only: Numeric Does Not Always Mean Relevant
numeric_only=True includes integer, float and Boolean columns while excluding names. It also includes ID here. Compare the numeric-column totals with a deliberately selected score total. The default is numeric_only=False; mixed string and numeric columns can fail for row-wise sums, so select the intended fields.
df = student_data()
print("All numeric columns, including ID:")
print(df.sum(numeric_only=True))
print("Row totals including ID:")
print(df.sum(axis=1, numeric_only=True))
print("Score columns only:")
print(df[["MATH", "ENGLISH"]].sum())
Expected output
All numeric columns, including ID:
ID          21
MATH       360
ENGLISH    330
dtype: int64
Row totals including ID:
0    161
1    112
2    113
3    124
4    135
5     66
dtype: int64
Score columns only:
MATH       360
ENGLISH    330
dtype: int64
Why Text May Concatenate Instead of Adding
Summing object-dtype strings can concatenate them. This does not make an all-column total meaningful. String dtype behaviour can vary by version; the example deliberately uses object dtype to demonstrate concatenation. For marks, select numeric score columns rather than relying on text handling.
df = student_data()
df["NAME"] = df["NAME"].astype("object")
print(df.sum(axis=0, numeric_only=False))
Expected output
NAME       RaviRajuAlexRonKingJack
ID                              21
MATH                           360
ENGLISH                        330
dtype: object
Selected Columns with a Named Index
A student name can be the row label while the score columns remain numeric. Column totals and row totals work the same way. Use set_index() when labels make the output easier to interpret.
df = pd.DataFrame({
    "name": ["Alex", "King", "Ravi", "Raju", "John"],
    "mark": [7, 8, 5, 6, 3],
    "math": [70, 80, 50, 60, 30]
}).set_index("name")
print("Column totals:")
print(df[["math", "mark"]].sum())
print("Row totals:")
print(df[["math", "mark"]].sum(axis=1))
Expected output
Column totals:
math    290
mark     29
dtype: int64
Row totals:
name
Alex    77
King    88
Ravi    55
Raju    66
John    33
dtype: int64
skipna: Ignore Missing Values or Require Completeness
The default skipna=True excludes missing values. This produces a subtotal of the available scores, not a replacement for missing scores. With skipna=False, a missing value makes the corresponding total missing. Decide which meaning your report needs before choosing the option.
df = student_data()
df.loc[2, "ENGLISH"] = float("nan")
scores = df[["MATH", "ENGLISH"]]
print("Available-score totals:")
print(scores.sum(skipna=True))
print("Require every value:")
print(scores.sum(skipna=False))
assert scores["ENGLISH"].sum(skipna=True) == 290
assert pd.isna(scores["ENGLISH"].sum(skipna=False))
Expected output
Available-score totals:
MATH       360.0
ENGLISH    290.0
dtype: float64
Require every value:
MATH       360.0
ENGLISH      NaN
dtype: float64
min_count: Do Not Turn an Unknown Total into Zero
min_count is the minimum number of non-missing values required for a result. The default is 0, so an empty or all-missing numeric Series sums to zero. Use min_count=1 when at least one known observation is required. Zero observed revenue and no known revenue are different states.
all_missing = pd.Series([float("nan"), float("nan")], dtype="float64")
empty = pd.Series([], dtype="float64")
print("All missing, default:", all_missing.sum())
print("All missing, min_count=1:", all_missing.sum(min_count=1))
print("Empty, default:", empty.sum())
print("Empty, min_count=1:", empty.sum(min_count=1))
assert all_missing.sum() == 0
assert pd.isna(all_missing.sum(min_count=1))
Expected output
All missing, default: 0.0
All missing, min_count=1: nan
Empty, default: 0.0
Empty, min_count=1: nan
Require Two Valid Scores for Each Student
min_count=2 requires both selected subject scores. Compare it with the available-score subtotal. An incomplete student row stays missing in the complete-total column, so it cannot be mistaken for a low score.
df = student_data()
df.loc[2, "ENGLISH"] = float("nan")
scores = df[["MATH", "ENGLISH"]]
df["AVAILABLE_TOTAL"] = scores.sum(axis=1)
df["COMPLETE_TOTAL"] = scores.sum(axis=1, min_count=2)
print(df[["NAME", "AVAILABLE_TOTAL", "COMPLETE_TOTAL"]])
assert df.loc[2, "AVAILABLE_TOTAL"] == 70
assert pd.isna(df.loc[2, "COMPLETE_TOTAL"])
Expected output
   NAME  AVAILABLE_TOTAL  COMPLETE_TOTAL
0  Ravi            160.0           160.0
1  Raju            110.0           110.0
2  Alex             70.0             NaN
3   Ron            120.0           120.0
4  King            130.0           130.0
5  Jack             60.0            60.0
Calculate a Grand Total Deliberately
For a selected numeric table, sum the column totals to obtain one scalar. Specify axis=0 explicitly instead of relying on version-dependent axis=None behaviour. The known-score subtotal ignores missing values; skipna=False in both steps propagates missing data into the complete grand total.
df = student_data()
scores = df[["MATH", "ENGLISH"]]
print("Grand total:", scores.sum(axis=0).sum())
assert scores.sum(axis=0).sum() == 690

df.loc[2, "ENGLISH"] = float("nan")
scores = df[["MATH", "ENGLISH"]]
print("Known-score subtotal:", scores.sum(axis=0, min_count=1).sum(min_count=1))
print("Complete grand total:", scores.sum(axis=0, skipna=False).sum(skipna=False))
Expected output
Grand total: 690
Known-score subtotal: 650.0
Complete grand total: nan
Sum a MultiIndex Level with groupby
For a hierarchical index, use groupby() with the level name, then call sum(). sort=False preserves first-seen group order. Use this form rather than passing level to sum().
index = pd.MultiIndex.from_arrays(
    [[1, 2, 3, 4, 5, 6],
     [80, 40, 70, 70, 70, 30],
     [80, 70, 40, 50, 60, 30]],
    names=["id", "math", "eng"]
)
marks = pd.Series([4, 2, 0, 8, 3, 4], name="marks", index=index)
result = marks.groupby(level="math", sort=False).sum()
print(result)
assert result.to_dict() == {80: 4, 40: 2, 70: 11, 30: 4}
Expected output
math
80     4
40     2
70    11
30     4
Name: marks, dtype: int64
Sum a Boolean Condition to Count Matches
True contributes 1 and False contributes 0, so the sum of a Boolean condition counts matching rows. This differs from summing the marks themselves. If a nullable condition contains unknown values, choose whether to exclude them or propagate the missing result.
df = student_data()
print("Students with MATH at least 70:", df["MATH"].ge(70).sum())
print("All students:", len(df))
print("Known MATH values:", df["MATH"].count())
assert df["MATH"].ge(70).sum() == 4
Expected output
Students with MATH at least 70: 4
All students: 6
Known MATH values: 6
Practical Dataset: Sales with Missing Inputs
This synthetic sample matches the downloadable sales CSV. A missing category can be labelled Unknown for reporting. A missing discount is treated as zero under the stated sample rule. Missing quantity or unit price remains unknown. See the fillna tutorial for choosing replacement rules.
from io import StringIO

def sales_data():
    csv_text = """order_id,category,quantity,unit_price,discount
1001,Stationery,2,20,0
1002,,1,15,
1003,Stationery,,10,0
1004,Office,3,,5
1005,Office,2,30,
"""
    return pd.read_csv(StringIO(csv_text))

df = sales_data()
df["category"] = df["category"].fillna("Unknown")
df["discount"] = df["discount"].fillna(0)
df["line_total"] = df["quantity"] * df["unit_price"] - df["discount"]
print(df)
assert df["line_total"].isna().sum() == 2
Expected output
   order_id    category  quantity  unit_price  discount  line_total
0      1001  Stationery       2.0        20.0       0.0        40.0
1      1002     Unknown       1.0        15.0       0.0        15.0
2      1003  Stationery       NaN        10.0       0.0         NaN
3      1004      Office       3.0         NaN       5.0         NaN
4      1005      Office       2.0        30.0       0.0        60.0
Report a Known Subtotal and Rows Needing Review
Three rows have enough information to calculate their net line amount. Two rows need review. Use min_count=1 for the known subtotal and skipna=False for a total that requires every row. Calling 115 the complete revenue total would hide the missing inputs.
df = sales_data()
df["discount"] = df["discount"].fillna(0)
df["line_total"] = df["quantity"] * df["unit_price"] - df["discount"]
known_subtotal = df["line_total"].sum(min_count=1)
complete_total = df["line_total"].sum(skipna=False)
review_rows = df["line_total"].isna().sum()
print("Known subtotal:", known_subtotal)
print("Complete total:", complete_total)
print("Rows needing review:", review_rows)
assert known_subtotal == 115
assert pd.isna(complete_total)
assert review_rows == 2
Expected output
Known subtotal: 115.0
Complete total: nan
Rows needing review: 2
Group Category Subtotals with Completeness Counts
Group the calculated amounts, not the raw quantity and price columns. A subtotal can be useful if you also show how many rows contributed. size() counts all rows in each group; count() counts known line amounts. The difference identifies rows needing review. These counts describe calculated records, not business certainty beyond the stated rules.
df = sales_data()
df["category"] = df["category"].fillna("Unknown")
df["discount"] = df["discount"].fillna(0)
df["line_total"] = df["quantity"] * df["unit_price"] - df["discount"]
groups = df.groupby("category")["line_total"]
report = groups.sum(min_count=1).to_frame("known_subtotal")
report["rows"] = groups.size()
report["calculated_rows"] = groups.count()
report["review_rows"] = report["rows"] - report["calculated_rows"]
print(report)
assert report["known_subtotal"].sum() == 115
assert report["review_rows"].sum() == 2
Expected output
            known_subtotal  rows  calculated_rows  review_rows
category
Office                60.0     2                1            1
Stationery            40.0     2                1            1
Unknown               15.0     1                1            0
Convert Numeric Text Before Summing
Imported numbers may arrive as strings. Convert with pd.to_numeric() and inspect failed conversions. errors="coerce" turns invalid text into missing values; it does not make the record valid. Report the known subtotal together with invalid or missing inputs, or use errors="raise" to stop immediately.
raw = pd.Series(["20", "15.5", "not recorded", None], name="amount")
amount = pd.to_numeric(raw, errors="coerce")
invalid_text = raw.notna() & amount.isna()
print("Known subtotal:", amount.sum(min_count=1))
print("Invalid text rows:", invalid_text.sum())
print("Missing or invalid amounts:", amount.isna().sum())
assert amount.sum(min_count=1) == 35.5
Expected output
Known subtotal: 35.5
Invalid text rows: 1
Missing or invalid amounts: 2
Common Questions and Mistakes
Why are IDs included? numeric_only=True selects numeric dtypes, not meaningful business measures. Select the required columns. Why is an empty total zero? The default min_count=0 permits zero valid values; set it to 1 to preserve unknown totals. Does skipna fill blanks? It excludes missing inputs from aggregation; it does not edit the source data. Why does a row sum fail? Select numeric fields rather than mixing names with numbers. Why does level fail? Use groupby(level=...).sum(). What about currency precision? Binary floats can introduce rounding effects. For exact money arithmetic, use an appropriate decimal representation or integer minor units and define the rounding policy. How can I plot totals? Follow the bar-chart tutorial, and label incomplete reports as known subtotals.
Exercise: Require Complete Student Totals
Set Ravi's ENGLISH score to missing. Calculate each row total using only MATH and ENGLISH, requiring both scores. Then report the sum of available complete-row totals and the number of incomplete students. Predict the result before running the solution: known complete-row subtotal 530; one incomplete student.
Exercise Solution
The row-level minimum count excludes an incomplete student from the known complete-row subtotal. The result is 530 for five complete rows; it is not the class's complete combined score.
df = student_data()
df.loc[0, "ENGLISH"] = float("nan")
totals = df[["MATH", "ENGLISH"]].sum(axis=1, min_count=2)
print("Known complete-row subtotal:", totals.sum(min_count=1))
print("Incomplete students:", totals.isna().sum())
assert totals.sum(min_count=1) == 530
assert totals.isna().sum() == 1
Expected output
Known complete-row subtotal: 530.0
Incomplete students: 1
Practice in Google Colab
Open in Google Colab View on GitHub
Run each example, change missing values and compare totals with different minimum counts. Both datasets are included. You can also download the sample sales CSV.
Continue with Data Exploration and Analysis, mean(), min(), max(), std() and describe(). For array aggregation, compare NumPy sum().
Reference: Pandas DataFrame.sum documentation.

Subhendu Mohapatra
Author & Instructor at plus2net
I write and maintain practical tutorials on Python, PHP, SQL, JavaScript, HTML, jQuery, and web development at plus2net. The tutorials focus on clear explanations, working examples, and code that readers can test and adapt while learning.


Subscribe to our YouTube Channel here

 Python Video Tutorials