read_excel()
import pandas as pd
df = pd.read_excel('D:\\student.xlsx') # Use your path to point to file
print(df.head()) # top five rows of the DataFrame id name class mark gender
0 1 John Deo Four 75 female
1 2 Max Ruin Three 85 male
2 3 Arnold Three 55 male
3 4 Krish Star Four 60 female
4 5 John Mike Four 60 female
read_excel(): Data from Excel to Pandas DataFrame #B01
Options :
Reading the worksheet
We can read any worksheet of the Excel file by using the option sheet_name. We have used one Excel file student.xlsx with two worksheets my_Sheet_1 and my_Sheet_2. You can create your own sample student.xlsx by using the code at the end of this tutorial.In above code change the line like this
df=pd.read_excel('student.xlsx',sheet_name='student'))df = pd.read_excel('D:\\student.xlsx', sheet_name='my_Sheet_1')index_col
By default value is None. This will add one index column to the DataFrame. We can specify one column to use as Index.import pandas as pd
df=pd.read_excel('student.xlsx',index_col='id')
print(df.head())header
By default the column header is 0. We can give integer values. Here is the code to start from 1st row.df = pd.read_excel('D:\\student.xlsx',header=1)header=None
If our file is not having header then we must keep header=None, by using header=None we can see the index will start from 0th row. Here is the output with header=None.df = pd.read_excel('D:\\student.xlsx',header=None) 0 1 2 3 4
0 id name class mark gender
1 1 John Deo Four 75 female
2 2 Max Ruin Three 85 male
3 3 Arnold Three 55 male
4 4 Krish Star Four 60 femalenames
We will create a list and use as our headers. We will also exclude the file header by using header=Noneimport pandas as pd
my_list=['header1','header2','header3','header4','header5']
df = pd.read_excel('D:\\student.xlsx',header=None,names=my_list)
print(df) header1 header2 header3 header4 header5
0 id name class mark gender
1 1 John Deo Four 75 female
2 2 Max Ruin Three 85 male
3 3 Arnold Three 55 male
4 4 Krish Star Four 60 femaleusecols
We can specify the columns to be used while creating the DataFrame. Here we are using only id and name columns to create the DataFrame.df = pd.read_excel('C:\\student.xlsx',usecols=['id','name']) df = pd.read_excel('C:\\student.xlsx',usecols=[0,1,3])dtype
While creating we can update the dtype of the column. Here mark column is changed to float data type.df = pd.read_excel('C:\\student.xlsx',dtype={'mark':float})print(df.info()) # Column Non-Null Count Dtype
--- ------ -------------- -----
0 id 35 non-null int64
1 name 35 non-null object
2 class 35 non-null object
3 mark 35 non-null float64
4 gender 35 non-null object
dtypes: float64(1), int64(1), object(3)
memory usage: 1.5+ KBconverters
Create one Date column while creating dataframe by using one column ( DATE_column ) . Here we used to_datetime to convert the column to date. This is helpful while converting dataframe to any Database by using to_sql()df = pd.read_excel('E:\\PAYMENTS.xlsx', converters= {'DATE_column': pd.to_datetime}) df = pd.read_excel('C:\\student.xlsx',converters={'mark': lambda x:x+10})Here we are adding 2 to all elements of mark column and adding 'Mr ' before all values of name column.
my_dict={'mark': lambda x:x+2,'name':lambda x:'Mr '+x}
df = pd.read_excel('C:\\student.xlsx',converters=my_dict)
print(df.head() id name class mark gender
0 1 Mr John Deo Four 77 female
1 2 Mr Max Ruin Three 87 male
2 3 Mr Arnold Three 57 male
3 4 Mr Krish Star Four 62 female
4 5 Mr John Mike Four 62 femaleskiprows
While creating DataFrame Skip row 2 and row 3.df = pd.read_excel('C:\\student.xlsx',skiprows=[2,3])df = pd.read_excel('C:\\student.xlsx',skiprows=6)df = pd.read_excel('C:\\student.xlsx',skiprows=lambda x: True if x % 2 == 0 else False) 1 John Deo Four 75 female
0 3 Arnold Three 55 male
1 5 John Mike Four 60 female
2 7 My John Rob Five 78 male
3 9 Tes Qry Six 78 male
4 11 Ronald Six 89 femalenrows
Number of rows to Parse.df = pd.read_excel('C:\\student.xlsx',nrows=2)skipfooter
Number of rows to skip at the end.df = pd.read_excel('C:\\student.xlsx',skipfooter=33)Unique values of a column
Download the sample student excel file. There are around 35 records. One of the column is class. Display the distinct or unique class names from this column. We will use unique() for this.import pandas as pd
df = pd.read_excel('D:\student.xlsx')
my_classes=df['class'].unique()
print(my_classes)['Four' 'Three' 'Five' 'Six' 'Seven' 'Nine' 'Eight']Creating demo file with sample data my_file.xlsx
import pandas as pd
my_dict={
	'NAME':['Ravi','Raju','Alex'],
	'ID':[1,2,3],'MATH':[30,40,50],
	'ENGLISH':[20,30,40]
	}

my_dict2={
	'NAME':['Ron','Pick','Rabin'],
	'ID':[4,5,6],'MATH':[60,40,30],
	'ENGLISH':[30,40,50]
	}

df = pd.DataFrame(data=my_dict)
df2 = pd.DataFrame(data=my_dict2)

with pd.ExcelWriter('D:my_file.xlsx') as my_excel_obj: #Object created
    df.to_excel(my_excel_obj,sheet_name='my_Sheet_1')
    df2.to_excel(my_excel_obj,sheet_name='my_Sheet_2')
Selecting Excel file to create DataFrame using Tkinter
Tkinter filedialog to browse and select excel file to create Pandas DataFrame using read_excel()
Tkinter is a python library used to create GUI applications. By using Tkinter filedialog we can browse and select excel file in local system. Using the selected excel file we can create a DataFrame and show the first 5 rows inside a text widget.
import tkinter as tk
from tkinter import *
from tkinter import filedialog
import pandas as pd

my_w = tk.Tk()
my_w.geometry("410x300")  # Size of the window
my_w.title('www.plus2net.com')
my_font1=('times', 18, 'bold')
l1 = tk.Label(my_w,text='Create DataFrame',width=30,font=my_font1)
l1.grid(row=0,column=1)
b1 = tk.Button(my_w, text='Upload Excel File',
   width=20,command = lambda:upload_file())
b1.grid(row=1,column=1)
t1 = tk.Text(my_w, height=7, width=45,bg='yellow') # added one text box
t1.grid(row=2,column=1,pady=10) #

def upload_file():
  file = filedialog.askopenfilename(
    filetypes=[("Excel file", ".xlsx")])
  df=pd.read_excel(file,index_col='id') # creating DataFrame
  t1.delete('1.0',END) # Delete previous data from position 0 till end
  t1.insert(tk.END, df.head()) # adding data to text widget
my_w.mainloop()  # Keep the window open
Reading Excel file and creating table in MySQL or SQLite database
Tkinter file browser to select Excel file for Inserting data to MySQL or SQLite database table
We will connect to MySQL database or SQLite database by using SQLAlchemy.
By using Tkinter filedialog we can browse and select excel file in local system.
Once the excel file is selected, we can read the file by using read_excel() to create the DataFrame. Using the DataFrame we will create the table by using to_sql(). We used try except code block to handle error.
import tkinter as tk
from tkinter import *
from tkinter import filedialog
import pandas as pd
from sqlalchemy import create_engine
from sqlalchemy.exc import SQLAlchemyError
#my_conn = create_engine("sqlite:///E:\\testing\\sqlite\\my_db4.db") # SQLite
my_conn =create_engine("mysql+mysqldb://u_id:pw@localhost/my_tutorial")

my_w = tk.Tk()
my_w.geometry("400x300")  # Size of the window
my_w.title('www.plus2net.com')

l1 = tk.Label(my_w,text='Upload File & Add to Database',width=30,font=18)
l1.grid(row=1,column=1,padx=5,pady=20)
b1 = tk.Button(my_w, text='Upload File',
   width=20,command =  lambda :upload_file())
b1.grid(row=2,column=1)

def upload_file():
    f_types = [('All Files', '*.*'),
             ('Excel files', '*.xlsx'),
             ('Text Document', '*.txt'),
              ('CSV files',"*.csv")]
    path = filedialog.askopenfilename(filetypes=f_types)
    if path:
        my_upd(path)
def my_upd(file):
    df = pd.read_excel(file)
    ### Creating new table my_table or appending existing table
    try:
        df.to_sql(con=my_conn,name='my_table',if_exists='append') #DataFrame
    except SQLAlchemyError as e:
        #print(e)
        error = str(e.__dict__['orig'])
        print(error)
    else:   # No error
        l1.config(text='Data added to table')
my_w.mainloop()  # Keep the window open
Using DataFrame column to create a list
DataFrame is created by using read_excel() function. From the DataFrame we can use one column data to create one list by using tolist().import pandas as pd
df=pd.read_excel("D:\\my_data\\tk-colours.xlsx") # Create DataFrame.
my_list=df['Name'].values.tolist() # list with column data Reading Google sheets data to create DataFrame

We can create DataFrame by using data from google sheets by using pygsheets library and google drive API.
get_as_df() DataFrame from Google sheet data
get_as_df() DataFrame from Google sheet data
Record details using Tkinter
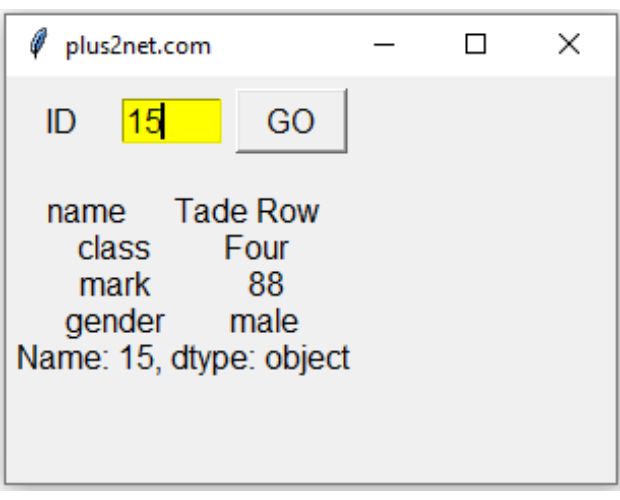
Use student.xlsx file to create a DataFrame.
Using Tkinter GUI, take input from user as Student id. Using the id to get the all details as per the excel record.
Display the record details in Tkinter window.
Use DataFrame loc to get row details.
import pandas as pd
df = pd.read_excel('E:\\data\\student.xlsx',index_col='id') # Excel path
#print(df.loc[id].tolist())  # as list
import tkinter as tk
my_w = tk.Tk()
my_w.geometry("300x200")  # with and height of the window
my_w.title("plus2net.com")  # Adding a title

l1 = tk.Label(my_w,  text='ID', width=5,font=18)  # added one Label
l1.grid(row=1,column=1,padx=2,pady=10)

e1 = tk.Entry(my_w,   width=5,bg='yellow',font=18) # added one Entry box
e1.grid(row=1,column=2,padx=2)

b1=tk.Button(my_w,text='GO', width=5,font=18,command=lambda:my_upd())
b1.grid(row=1,column=3,padx=5)

l2 = tk.Label(my_w,  text='Details', font=10)  # added one Label
l2.grid(row=2,column=1,padx=2,pady=10,columnspan=3)

def my_upd():
    id=int(e1.get()) # read the user entered data or id
    l2.config(text=df.loc[id]) # update the Label
my_w.mainloop()
Excel file to HTML table
iterrows() : Iterate over DataFrame rows .import pandas as pd
df = pd.read_excel("D:\\student.xlsx")
#print(df)
for index, row in df.iterrows():
print(""+ row['name']+" "+ row['class']+" "+str(row['mark'])+" "+row['gender']+" Questions
- How do you read an Excel file using the
read_excel()function in Pandas? - What is the default value for the
sheet_nameparameter in theread_excel()function? - How can you read a specific sheet from an Excel file using the
read_excel()function? - What is the purpose of the
headerparameter in theread_excel()function? - How can you skip a specific number of rows while reading an Excel file using the
read_excel()function? - How do you specify a subset of columns to read from an Excel file using the
read_excel()function? - How can you handle missing values while reading an Excel file with the
read_excel()function? - What is the purpose of the
dtypeparameter in theread_excel()function? - How do you read multiple sheets from an Excel file into separate DataFrames using the
read_excel()function? - How can you customize the column names of the resulting DataFrame when reading an Excel file with the
read_excel()function?
Data input and output from Pandas DataFrame
SQLite table to DataFrame Colab platform using read_sql() Search DataFrame by user inputs through Tkinter.
Pandas read_csv() to_csv() to_excel()

Subhendu Mohapatra
Author
🎥 Join me live on YouTubePassionate about coding and teaching, I publish practical tutorials on PHP, Python, JavaScript, SQL, and web development. My goal is to make learning simple, engaging, and project‑oriented with real examples and source code.
Subscribe to our YouTube Channel here
This article is written by plus2net.com team.
https://www.plus2net.com

 Python Video Tutorials