SEO reports using Pandas
";require "templates/body_start.php";?>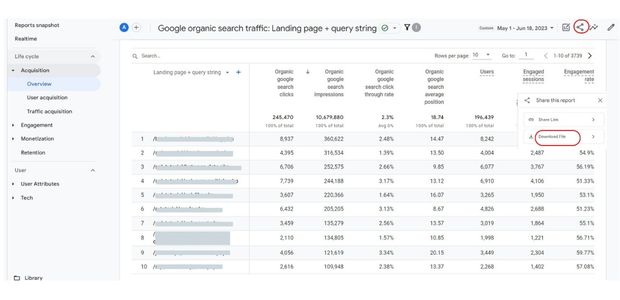
From inside the Google Analytics GA4 report, download the CSV ( Comma Separated Value ) file
Google organic search traffic: Landing page + query string
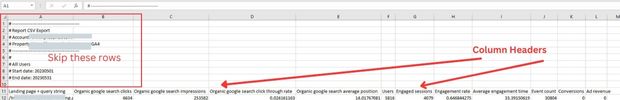
We can skip the top rows and manage our own column headers. While creating the DataFrame from CSV file we will use the options skiprows, usecols,index_col and names to customize the DataFrame as per our requirement.
While using usecols we have given 6 columns ( 0 indexed ) starting from first column as 0. To match these 6 columns we have used a list of column headers l_headers based on our required headers.
l_headers=['page','clicks','imp','ctr','position','tm'] # Changed the name of the columns df=pd.read_csv(path,skiprows=11,usecols=[0,1,2,3,4,8],index_col=0,names=l_headers)import pandas as pd#path and name of downloaded csv file. path='D:\\testing\\analytics\\data\\y24_09.csv'month_name='24-Sep' # should match with above csv file of the monthtable_name='y_all' # Common table all months ####### No edit ######l_headers=['page','clicks','imp','ctr','position','tm'] # Changed the name of the columns df=pd.read_csv(path,skiprows=11,usecols=[0,1,2,3,4,8],index_col=0,names=l_headers) # remove first 6 linesdf['position']=df['position']. round(2)df['ctr']=df['ctr']. round(2)df['tm']=df['tm']. round(2)df['month']=month_namedf=df[~df.index.str.contains('\?')] # remove rows having ? in url or page column print(df.head())## Inserted the DataFrame to SQLite database from sqlalchemy import create_enginemy_conn = create_engine("sqlite:///C:\\xampp\\htdocs\\my_dir\\templates\\temp1\\analytics3.db")my_conn=my_conn.connect()#df.to_sql(con=my_conn,name=table_name,if_exists='append') How to Analyze Keyword Combinations and Their Rank Positions
Download keyword list from the Google Search Console in CSV format.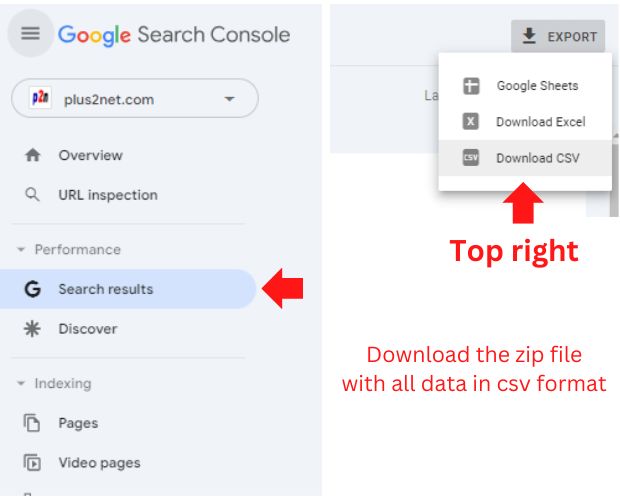
This step by step approach helps in identifying which keywords are performing well and which ones may need more focus for optimization.
Download the query list in csv format from Google Search Console
Performance > Search results >
Top right corner check for download link and then select download CSV.
Inside the zip file there will be a file Queris.csv, we will use this file for our analysis.
Read the csv file by using read_csv(), by using the column Queries we will create one new dataframe (df).
import pandas as pddf=pd.read_csv('F:\\webmaster-console-query-data\\Queries.csv') # use your system pathlist_words=['tkinter','color'] # List of keywords to check ranking my_str = '|'.join(list_words) # tkinter | color , the OR combination df2=df[df['queries'].str.contains(my_str,case=False)]print(df2)For an AND combination where presence of all keywords is to be checked against the query we have to modify the code like this.
list_words=['tkinter','color'] # List of keywords to check ranking ## my_str = '|'.join(list_words) # tkinter | color , only for the OR combination my_str=''for w in list_words: my_str=my_str + "(?=.*" + w + ")"print(my_str) # check the string before applying #df2=df[df['queries'].str.contains(r'^(?=.*tkinter)(?=.*color)',case=False)]df2=df[df['queries'].str.contains(my_str,case=False)]print(df2)df2=df[df['queries'].str.contains(my_str,case=False)]df2 = df2[df2["Position"].between(6,10)] # Position between two ranks Frequency of key words
While creating the dataframe we will use str to create string, then split the string and use stack. Finally we will use value_count() to create a list of key words with the frequency of their occurrence.
We are storing the final key word list with the frequency of occurrence using CSV file using to_csv().
This gives us the list of words which are as per google have relatively better authoritativeness ( Part of E-A-T : expertise authoritativeness and trustworthiness).
import pandas as pddf=pd.read_csv('F:\\webmaster-console-query-data\\Queries.csv') # use your system pathdf2 = df["queries"].str.split(expand=True).stack().value_counts()print(df2.head(15)) # printing top 15 keywordsdf2.to_csv("H:\\data\\seo\\to_words.csv") # saving to csv file, change to your pathCreating sitemap
We will use on excel page or take the url list from the database.Here is the code to read the directory and to create the excel page or database.
Using this we will create the sitemap page in XML format.
import pandas as pdl1=['javascript_tutorial','php_tutorial','html_tutorial','sql_tutorial','python','jquery','c-tutorial']l1=['c-tutorial'] # comment this line to update all directories for d in l1: #path = "C:\\xampp\\htdocs\\plus2net\\"+d+"\\" # full path to directory f_x='E:\\testing\\sitemap\\'+d+'.xlsx' # path of excel file. df=pd.read_excel(f_x) #condition=(df['tag_canonical']<3) & (df['tag_head']==1) condition=(df['tag_head']!=0) # exclude some files based on condition df=df.loc[condition] my_str='\n' my_str=my_str+'\n' def print_row(row): global my_str,d #print(f"Name: {row['f_name']}, Date: {row['dt']}") my_str=my_str+f"{row['url']} {row['dt']} " path=path+"sitemap.xml" with open(path, 'w') as file: file.write(my_str) print("For ",d," Total : ",len(df))Pandas contains() split() slice()