to_html() : DataFrame to html
import pandas as pd
my_dict={
	'NAME':['Ravi','Raju','Alex'],
	'ID':[1,2,3],'MATH':[30,40,50],
	'ENGLISH':[20,30,41]
	}
df = pd.DataFrame(data=my_dict) # create DataFrame from dictionary
df.to_html('D:\my_html.html')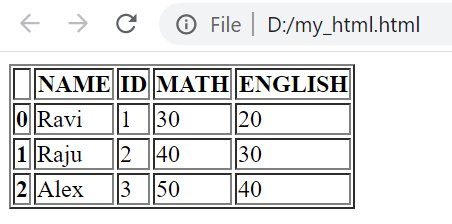
We saved the DataFrame data as table inside .html ( web page ) file.
Python Pandas html output from DataFrame & using MySQL sample table as source by to_html()
By default we will have index as left most column. We can remove index by using option index=False
df.to_html('D:\my_html.html',index=False)Storing Path
We kept the file in D drive ( root )df.to_html('D:\my_file.html')df.to_html('D:\data\my_file.html')Options
buf: Buffer to write. columns : Default value is None, write all columns. The sub list of columns to generate. col_space: Optional, css width in pixel. Output <th style="min-width: 20px;">header: Default value is True,bool Optional. To print column headers (True ) or notindex: Default value is True, bool Optional. To print index row ( True ) or not na_rep: How to handle NaN enteries. formatters : Function to apply for column elements for formatting. float_format : Formatter function for floats. sparsify: To print hierarchical indexindex_names : Bool , optional, default True. Print name of Indexes justify: Justify column labels. Values are left,right,center,justify,justify-all,start,end,inherit,match-parent,initial,unset.max_rows: int , Optional. Maximum number of rows to display.max_cols: int , Optional. Maximum number of columns to display. show_dimensions: bool, default False. decimal: Decimal separator. Example , is used in Europe. bold_rows: Bool, default True, mark row labels bold.classes: (HTML ) Class to add to table for style. escape : Bool,default True. Converts < , > and & notebook : Bool, the output is for IPython Notebook.border : int, border width included in <table> tag, default value is 1, set to 0 to remove border. table_id : A css id for the html table. render_links : Default False. Converts URL to Linkencoding :str,encoding, default 'utf-8' Output : String or None based on buf setting.
Examples
We can specify the columns to be used withindex=False
import pandas as pd
df=pd.read_excel("E:\\data\\student.xlsx") # Path of the file.
l1=['id','name','mark'] # List of columns to show in html table
df.to_html('E:\\data\\my_html.html',index=False,columns=l1)
max_rows and max_cols
df.to_html('C:\\data\\student.html',max_rows=5,max_cols=3)remove header
df.to_html('C:\\data\\student.html',index=None,header=False)classes
This will add the class to HTML generated table.df.to_html('C:\\data\\student.html',classes="table table-striped")col_space
This will add width to table header row<th style="min-width: 50px;">id</th>
df.to_html('C:\\data\\student.html',col_space=50)na_rep Blank data
How to handle if data is blank, we can use na_rep='*'import pandas as pd
import numpy as np
my_dict={
'NAME':['Ravi','Raju','Alex'],
'ID':[1,2,3],'MATH':[30,np.nan,50],
'ENGLISH':[20,30,41]
}
df = pd.DataFrame(data=my_dict) # create DataFrame from dictionary
print(df.to_html(na_rep='*'))show_dimensions
print(df.to_html(show_dimensions=True))<p>3 rows × 4 columns</p>decimal
In place of using a dot ( . ) we can use comma as decimal indicator, this is used in Europe.import pandas as pd
my_dict={
'NAME':['Ravi','Raju','Alex'],
'ID':[1,2,3],'MATH':[30,80,50],
'ENGLISH':[20.5,30.65,41.898]
}
df = pd.DataFrame(data=my_dict) # create DataFrame from dictionary
print(df.to_html(decimal=','))table_id
We can add one css id to the table generated.print(df.to_html(table_id='my_table'))<table border="1" class="dataframe" id="my_table">Storing part of the data
We can filter the DataFrame and then save the rows in html file. For this we will use our test.csv file as we have more rows.Now let us store only two columns, class and name
import pandas as pd
df=pd.read_csv('test.csv')
df=df.loc[:,['class','name']]
df = pd.DataFrame(data=df)
df.to_html('my_file.html',index=False)Data from MySQL table to html file
Read on how to connect to MySQL database and then collected the records of student table by using read_sql() to a DataFrame. Finally we will save them in an html file using to_html().import mysql.connector
import pandas as pd
my_connect = mysql.connector.connect(
host="localhost",
user="root",
passwd="*****",
database="my_tutorial"
)
####### end of connection ####
sql="SELECT * FROM student limit 0,5"
df = pd.read_sql(sql,my_connect )
df.to_html('D:\my_student_file.html',index=False)Using SQLAlchemy
We will collect records from our sample student table in MySQL database and display as html using to_html().Collect SQL dump of sample student table below.
Read more on MySQL with SQLAlchemy connection. you can add path if you want the file ( with html tags )to be created with the ( sample is given above )
import pandas as pd
from sqlalchemy import create_engine
my_conn = create_engine("mysql+mysqldb://userid:pw@localhost/my_db")
sql="SELECT * FROM student LIMIT 0,10 "
df = pd.read_sql(sql,my_conn)
df.to_html('D:\\df\\my_html.html')
From Excel file to HTML output
In above code we have created one DataFrame by taking data from a MySQL database table. We can create DataFrame by using any excel data or by using any csv file or from any other sources. ( check here to create a DataFrame from 8 different sources )Once a DataFrame is created, then using that we can create html output by using to_html(). Here is one example to read one Excel file to a DataFrame and generate the string, you can explore other sources to create a DataFrame and finally generate html tags / file.
We used read_excel() to read our sample student.xlsx file.
df=pd.read_excel("D:\\my_data\\student.xlsx") # Path of the file.
df.to_html('D:\\my_data\\my_html.html')df=pd.read_csv("D:\\my_data\\student.csv") # change the path
df.to_html('D:\\my_data\\my_html.html')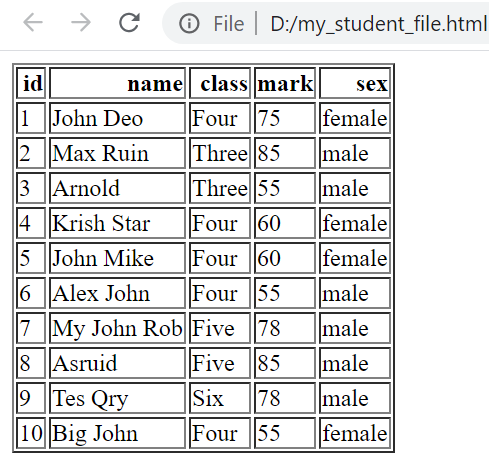
Adding style using classes option
import pandas as pd
df=pd.read_excel("E:\\data\\student.xlsx") # Path of the file.
df.to_html('E:\\data\\my_html.html',classes='center') # File created<table border="1" class="dataframe center">
<thead">
<tr style="text-align: right;">
-----
-----<style>.center {
margin-left: auto;
margin-right: auto;
}</style>print(df.to_html(classes='center'))Copy tabular data from URL and create html table
Select the tabular data from any webpage and copy to clipboard. Then run this code to generate the html table to use in any html page.This sample URL is used. https://www.php.net/manual/en/errorfunc.constants.php
import pandas as pd
df=pd.read_clipboard(index_col='Value') # use value column as index
df=df.drop(columns='Note') # delete the Note column
print(df.to_html(classes="table table-striped"))Questions
- How can I include only specific columns from a DataFrame in the HTML table generated by
to_html()? - Is it possible to specify the CSS classes for the HTML table using the
to_html()function? - How can I remove the index column from the HTML table produced by
to_html()? - Can I customize the representation of missing values (NaN) in the HTML table generated by
to_html()? - Is there a way to control the width of the columns in the HTML table created by
to_html()? - How can I save the HTML table generated by
to_html()to a file instead of printing it to the console? - Can I include the column names as table headers in the HTML output using
to_html()? - Is it possible to remove the table borders in the HTML output created by
to_html()? - How can I align the table cells to the center in the HTML table produced by
to_html()? - Can I include row and column labels (index names) in the HTML table generated by
to_html()?
Data input and output from Pandas DataFrame
Pandas read_html() read_csv() read_excel() to_excel()

Subhendu Mohapatra
Author
🎥 Join me live on YouTubePassionate about coding and teaching, I publish practical tutorials on PHP, Python, JavaScript, SQL, and web development. My goal is to make learning simple, engaging, and project‑oriented with real examples and source code.
Subscribe to our YouTube Channel here
This article is written by plus2net.com team.
https://www.plus2net.com

 Python Video Tutorials