Python xlsxwriter Library
Write data image chart to Excel from List or dictionary in format using Python xlsxwriter library
A Python module for creating Excel XLSX files.
To install the library
pip install xlsxwriter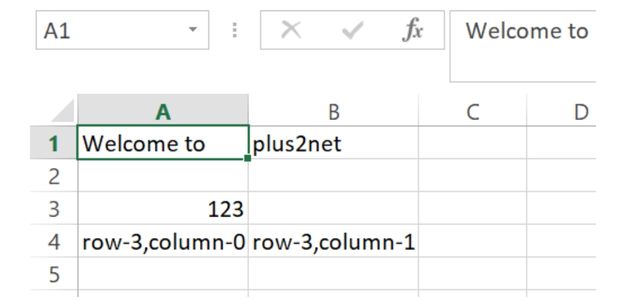
import xlsxwriter
my_path='G:\\My drive\\testing\\xlsxwriter\\demo1.xlsx'#Path
wb = xlsxwriter.Workbook(my_path) # create workbook
ws = wb.add_worksheet() # Add worksheet

ws.set_column('A:A',13) # increase width of the column
ws.set_column('B:B',13) # increase width of the column

#Using Cell address
ws.write('A1', 'Welcome to ')
ws.write('B1', 'plus2net')

# using row/column notation. Starting with row=0,column=0

ws.write(2,0, 123) # row 2 , column 0
ws.write(3,0, 'row-3,column-0')
ws.write(3,1, 'row-3,column-1')
wb.close()
add_format()
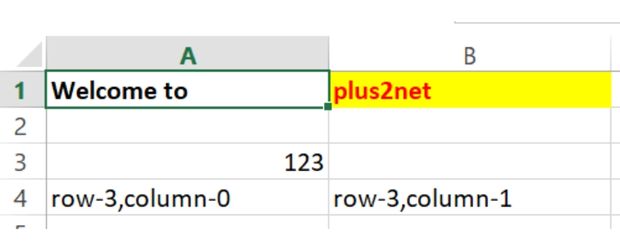
bold = wb.add_format({'bold': True}) # Adding bold format
my_format = wb.add_format({'bold': True,
	'font_color': 'red','bg_color':'#FFFF00'})
# Text with formatting.
ws.write('A1', 'Welcome to ',bold) # adding bold format
ws.write('B1', 'plus2net',my_format) # adding font and background color
write() : Adding List to Excel file
import xlsxwriter
my_path='G:\\My drive\\testing\\xlsxwriter\\demo1.xlsx'
wb = xlsxwriter.Workbook(my_path) # create workbook
ws = wb.add_worksheet() # Add worksheet

l1 = [1,2,3,4,5,6,7] # List to populate
r,c=0,0 # starting row and column

for data in l1:
    ws.write(r,c,data)
    r=r+1 # increase row value by 1
wb.close()import xlsxwriter
my_path='G:\\My drive\\testing\\xlsxwriter\\demo1.xlsx'
wb = xlsxwriter.Workbook(my_path) # create workbook
ws = wb.add_worksheet() # Add worksheet
l1 = [1,2,3,4,5,6,7] # List to populate
ws.write_row('A1', l1) # Add list in one row
wb.close()write_formula()
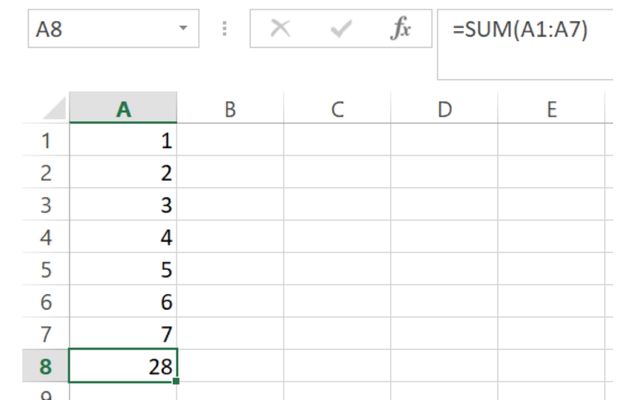
Using formula, we will add all the cell values from A1 to A7 and display the same at A8
import xlsxwriter
my_path='G:\\My drive\\testing\\xlsxwriter\\demo1.xlsx'
wb = xlsxwriter.Workbook(my_path) # create workbook
ws = wb.add_worksheet() # Add worksheet

l1 = [1,2,3,4,5,6,7] # List to populate
r,c=0,0 # starting row and column

for data in l1:
    ws.write(r,c,data)
    r=r+1 # increase row value by 1

ws.write_formula('A8', '=SUM(A1:A7)')
wb.close()
Adding dictionary to Excel file
import xlsxwriter
my_path='G:\\My drive\\testing\\xlsxwriter\\demo1.xlsx'
wb = xlsxwriter.Workbook(my_path) # create workbook
ws = wb.add_worksheet() # Add worksheet
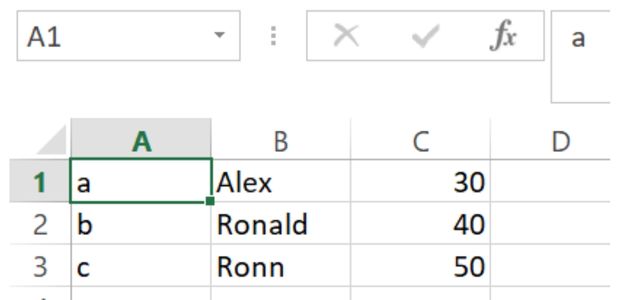
my_dict={'a':['Alex',30],'b':['Ronald',40],'c':['Ronn',50]}
r,c=0,0 # starting row and column
for k in my_dict:
ws.write(r,c,k) # adding Key at first column
ws.write_row(r,c+1,my_dict[k]) # adding List after key in same row
r=r+1 #increase row value by 1
wb.close()insert_image() : Adding image to Excel file
import xlsxwriter
my_path='G:\\My drive\\testing\\xlsxwriter\\demo1.xlsx'
wb = xlsxwriter.Workbook(my_path) # create workbook
ws = wb.add_worksheet() # Add worksheet
ws.insert_image('A1', 'D:\\top2.jpg') # Cell and Path of the image
l1 = [1,2,3,4,5] # List to populate
ws.write_row(3,0, l1) # Add list in one row
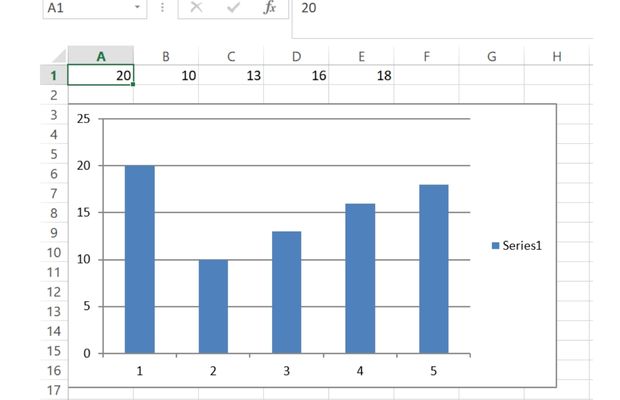
wb.close()insert_chart() : Adding chart
import xlsxwriter
my_path='G:\\My drive\\testing\\xlsxwriter\\demo1.xlsx'
wb = xlsxwriter.Workbook(my_path) # create workbook
ws = wb.add_worksheet() # Add worksheet
l1 = [20,10,13,16,18] # List to populate
ws.write_row(0,0, l1) # Add list in one row

chart = wb.add_chart({'type': 'column'}) # chart object
chart.add_series({'values': '=Sheet1!$A$1:$E$1'}) # Adding series
ws.insert_chart('A3', chart) # adding chart
wb.close()Export SQLite database table to Excel in Colab platform using xlsxwriter
Python openpyxl library

Subhendu Mohapatra
Author
🎥 Join me live on YouTubePassionate about coding and teaching, I publish practical tutorials on PHP, Python, JavaScript, SQL, and web development. My goal is to make learning simple, engaging, and project‑oriented with real examples and source code.
Subscribe to our YouTube Channel here
This article is written by plus2net.com team.
https://www.plus2net.com

31-10-2022 | |
| HELLO Friend I have question related to your code here: chart = wb.add_chart({'type': 'column'}) # chart object chart.add_series({'values': '=Sheet1!$A$1:$E$1'}) # Adding series and here is my python code for my excel sheet chart1.add_series({'values': '=Swap Report!$I$1:$M$1', 'fill': {'color': 'red'}, 'border': {'color': 'black'}}) it is not working and show me only empty chart ?? what should I do | |
 Python Video Tutorials