Pandas DataFrame Plots
Let us create a DataFrame with name of the students and their marks.


Saving graph as image
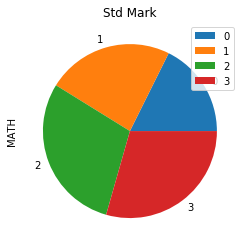
plot=df.plot.pie(title="Colors",y='MATH',autopct='%1.1f%%')
fig = plot.get_figure()
fig.savefig("D:\\my_data\\output2.png")subplots=True
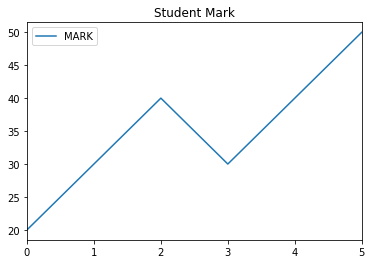
plot=df.plot.line(subplots=True)[0].get_figure()
plot.savefig('my_pic.jpg')| plot-line | Plotting line graph with different options |
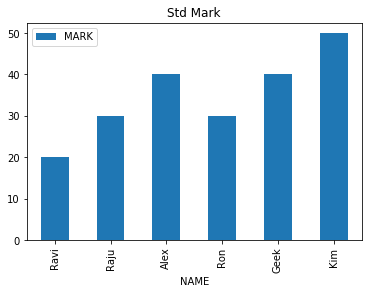
| plot-bar | Plotting bar graph with different options |
| plot-barh | Plotting Horizontal bar graph with different options |
| plot-hist | Histogram with different options |
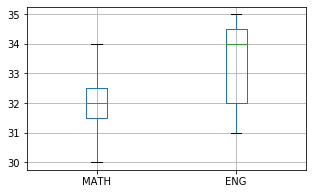
| plot-boxplot | boxplot with different options |
| plot-pie | Pie diagram with different options |
| plot-density | Density diagram with different options |
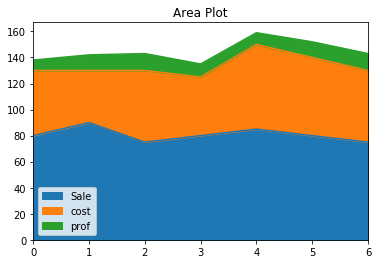
| plot-area | Area diagram with different options |
| plot-scatter | Scatter plot with different options |
Try the exercise on Pandas Plot
Graph using data from MySQL database Displaying graph on Tkinter GUI
Pandas to_csv() Filtering of Data

Subhendu Mohapatra
Author
🎥 Join me live on YouTubePassionate about coding and teaching, I publish practical tutorials on PHP, Python, JavaScript, SQL, and web development. My goal is to make learning simple, engaging, and project‑oriented with real examples and source code.
Subscribe to our YouTube Channel here
This article is written by plus2net.com team.
https://www.plus2net.com

 Python Video Tutorials