Pandas Practice Data: Sales, Products and Customers
Use these synthetic sales, products and customers tables to practise checked joins and reports. Create all tables in one cell, inspect their relationships and reconcile totals before exporting.
Show Table of Contents ↓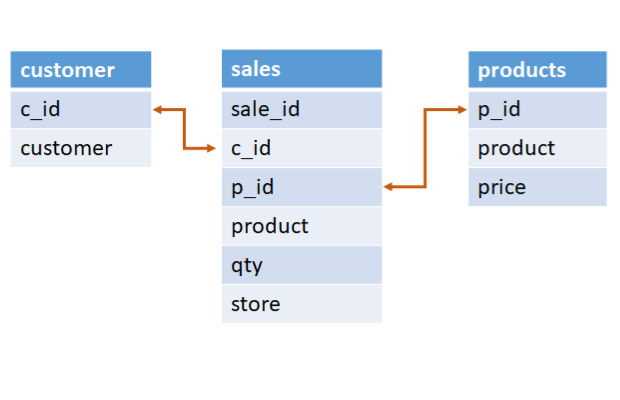
Create all three practice tables 🔝
Each sales row is one sale line. sale_id identifies the line; c_id and p_id connect it to the customer and product tables. The product field in sales repeats a description, so join on p_id rather than on that text.
import pandas as pd
from io import StringIO

def sample_tables():
    sales = pd.DataFrame({
        "sale_id": [1, 2, 3, 4, 5, 6, 7, 8, 9],
        "c_id": [2, 2, 1, 4, 2, 3, 2, 3, 2],
        "p_id": [3, 4, 3, 2, 3, 3, 2, 2, 3],
        "product": ["Monitor", "CPU", "Monitor", "RAM", "Monitor", "Monitor", "RAM", "RAM", "Monitor"],
        "qty": [2, 1, 3, 2, 3, 2, 3, 2, 2],
        "store": ["ABC", "DEF", "ABC", "DEF", "ABC", "DEF", "ABC", "DEF", "ABC"]
    })
    products = pd.DataFrame({
        "p_id": [1, 2, 3, 4, 5, 6, 7, 8],
        "product": ["Hard Disk", "RAM", "Monitor", "CPU", "Keyboard", "Mouse", "Motherboard", "Power supply"],
        "price": [80, 90, 75, 55, 20, 10, 50, 20]
    })
    customers = pd.DataFrame({
        "c_id": [1, 2, 3, 4, 5, 6, 7, 8],
        "Customer": ["Rabi", "Raju", "Alex", "Rani", "King", "Ronn", "Jem", "Tom"]
    })
    return sales, products, customers

sales, products, customers = sample_tables()
print("Sales:", sales.shape, "Products:", products.shape, "Customers:", customers.shape)
Expected output
Sales: (9, 6) Products: (8, 3) Customers: (8, 2)Inspect the sales table 🔝
qty is the quantity on the sale line, not the number of distinct orders or customers. This sample has six sales columns and nine lines.
print(sales)
print("Sale lines:", len(sales), "Units:", sales["qty"].sum())
assert sales.shape == (9, 6)
assert sales["qty"].sum() == 20
Expected output
   sale_id  c_id  p_id  product  qty store
0        1     2     3  Monitor    2   ABC
1        2     2     4      CPU    1   DEF
2        3     1     3  Monitor    3   ABC
3        4     4     2      RAM    2   DEF
4        5     2     3  Monitor    3   ABC
5        6     3     3  Monitor    2   DEF
6        7     2     2      RAM    3   ABC
7        8     3     2      RAM    2   DEF
8        9     2     3  Monitor    2   ABC
Sale lines: 9 Units: 20
Inspect products and sample prices 🔝
The product table contains products without sales too. For this exercise, price is a fixed sample unit price. Real revenue often needs the actual price recorded at sale time, discounts, returns and tax rules.
print(products)
assert products.shape == (8, 3)
Expected output
   p_id       product  price
0     1     Hard Disk     80
1     2           RAM     90
2     3       Monitor     75
3     4           CPU     55
4     5      Keyboard     20
5     6         Mouse     10
6     7   Motherboard     50
7     8  Power supply     20
Inspect the customer table 🔝
Customers without sales remain in the lookup table. Counting lookup rows is different from counting customers who purchased.
print(customers)
print("Customers with sales:", sales["c_id"].nunique())
assert customers.shape == (8, 2)
assert sales["c_id"].nunique() == 4
Expected output
   c_id Customer
0     1     Rabi
1     2     Raju
2     3     Alex
3     4     Rani
4     5     King
5     6     Ronn
6     7      Jem
7     8      Tom
Customers with sales: 4
Check required keys and quantities 🔝
Validate lookup uniqueness before joining. Repeated customer or product IDs in sales are expected; repeated keys in a lookup can multiply rows. See duplicated() and the Data Cleaning hub.
for frame, key in [(sales, "sale_id"), (products, "p_id"), (customers, "c_id")]:
    assert frame[key].notna().all()
    assert frame[key].is_unique
assert sales["qty"].gt(0).all()
assert products["price"].ge(0).all()
print("Unique keys and positive quantities checked")
Expected output
Unique keys and positive quantities checkedJoin products without losing sale lines 🔝
Use a left merge() with validate="many_to_one". Preserve both descriptions to check whether the sales text matches the product lookup. The indicator exposes unmatched product IDs.
joined = sales.merge(products, on="p_id", how="left", validate="many_to_one",
    suffixes=("_sale", "_catalog"), indicator="product_match")
print(joined)
print("Matches:", joined["product_match"].value_counts().to_dict())
assert len(joined) == len(sales)
assert joined["product_match"].eq("both").all()
assert joined["product_sale"].equals(joined["product_catalog"])
Expected output
   sale_id  c_id  p_id product_sale  ...  store product_catalog price  product_match
0        1     2     3      Monitor  ...    ABC         Monitor    75           both
1        2     2     4          CPU  ...    DEF             CPU    55           both
2        3     1     3      Monitor  ...    ABC         Monitor    75           both
3        4     4     2          RAM  ...    DEF             RAM    90           both
4        5     2     3      Monitor  ...    ABC         Monitor    75           both
5        6     3     3      Monitor  ...    DEF         Monitor    75           both
6        7     2     2          RAM  ...    ABC             RAM    90           both
7        8     3     2          RAM  ...    DEF             RAM    90           both
8        9     2     3      Monitor  ...    ABC         Monitor    75           both

[9 rows x 9 columns]
Matches: {'both': 9, 'left_only': 0, 'right_only': 0}
Add customer names and reconcile rows 🔝
A second checked left join adds customer details. Do not silently replace unknown keys with guessed names or discard unmatched records.
enriched = joined.merge(customers, on="c_id", how="left", validate="many_to_one", indicator="customer_match")
print(enriched[["sale_id", "Customer", "product_catalog", "qty", "price", "store"]])
assert enriched["customer_match"].eq("both").all()
assert len(enriched) == len(sales)
assert enriched["qty"].sum() == sales["qty"].sum()
Expected output
   sale_id Customer product_catalog  qty  price store
0        1     Raju         Monitor    2     75   ABC
1        2     Raju             CPU    1     55   DEF
2        3     Rabi         Monitor    3     75   ABC
3        4     Rani             RAM    2     90   DEF
4        5     Raju         Monitor    3     75   ABC
5        6     Alex         Monitor    2     75   DEF
6        7     Raju             RAM    3     90   ABC
7        8     Alex             RAM    2     90   DEF
8        9     Raju         Monitor    2     75   ABC
Calculate sample line revenue 🔝
This practice rule uses qty times the fixed lookup price. All lookup matches have been checked before calculating the report.
enriched["revenue"] = enriched["qty"] * enriched["price"]
print(enriched[["sale_id", "product_catalog", "qty", "price", "revenue"]])
print("Total revenue:", enriched["revenue"].sum())
assert enriched["revenue"].sum() == 1585
Expected output
   sale_id product_catalog  qty  price  revenue
0        1         Monitor    2     75      150
1        2             CPU    1     55       55
2        3         Monitor    3     75      225
3        4             RAM    2     90      180
4        5         Monitor    3     75      225
5        6         Monitor    2     75      150
6        7             RAM    3     90      270
7        8             RAM    2     90      180
8        9         Monitor    2     75      150
Total revenue: 1585
Summarize stores with groupby() 🔝
Count sale lines, sum units and sum revenue as separate measures. groupby() provides the grouped report; reconcile it with the full table.
store_report = enriched.groupby("store", as_index=False).agg(
    sale_lines=("sale_id", "size"), units=("qty", "sum"), revenue=("revenue", "sum")
)
print(store_report)
assert store_report["revenue"].sum() == enriched["revenue"].sum()
assert store_report["units"].sum() == 20
Expected output
  store  sale_lines  units  revenue
0   ABC           5     13     1020
1   DEF           4      7      565
Summarize customer purchases 🔝
Count known customer IDs rather than names when identifying customers. Different customers can share a name. Keep the lookup key in the report.
customer_report = enriched.groupby(["c_id", "Customer"], as_index=False).agg(
    sale_lines=("sale_id", "size"), revenue=("revenue", "sum")
)
print(customer_report)
assert len(customer_report) == 4
assert customer_report["revenue"].sum() == 1585
Expected output
   c_id Customer  sale_lines  revenue
0     1     Rabi           1      225
1     2     Raju           5      850
2     3     Alex           2      330
3     4     Rani           1      180
Find products with no sales 🔝
Lookup products absent from the sale lines are not missing data errors. They may simply have no sales in the supplied period. The sample has no dates, so it cannot establish monthly trends.
unsold = products.loc[~products["p_id"].isin(sales["p_id"])]
print(unsold)
assert unsold["p_id"].tolist() == [1, 5, 6, 7, 8]
Expected output
   p_id       product  price
0     1     Hard Disk     80
4     5      Keyboard     20
5     6         Mouse     10
6     7   Motherboard     50
7     8  Power supply     20
Practise reviewing an unknown product ID 🔝
This deliberately altered copy contains an unknown product. A checked left join retains it for review. Missing prices must not become zero just to force a revenue total.
changed = sales.copy()
changed.loc[0, "p_id"] = 999
checked = changed.merge(products[["p_id", "price"]], on="p_id", how="left", validate="many_to_one", indicator=True)
review = checked.loc[checked["_merge"].eq("left_only")]
print(review)
assert review["sale_id"].tolist() == [1]
assert review["price"].isna().all()
Expected output
   sale_id  c_id  p_id  product  qty store  price     _merge
0        1     2   999  Monitor    2   ABC    NaN  left_only
Create downloadable practice CSV files 🔝
These tables are embedded so you can generate CSV files in Colab without depending on an external download. index=False avoids exporting an extra row-number column. See read_csv() and Input and Output.
sales_csv = sales.to_csv(index=False)
products_csv = products.to_csv(index=False)
customers_csv = customers.to_csv(index=False)
print(sales_csv.rstrip())
round_trip = pd.read_csv(StringIO(sales_csv))
assert round_trip.equals(sales)
# Optional files in Colab:
# sales.to_csv("sales.csv", index=False)
# products.to_csv("products.csv", index=False)
# customers.to_csv("customer.csv", index=False)
# from google.colab import files
# files.download("sales.csv")
Expected output
sale_id,c_id,p_id,product,qty,store

1,2,3,Monitor,2,ABC

2,2,4,CPU,1,DEF

3,1,3,Monitor,3,ABC

4,4,2,RAM,2,DEF

5,2,3,Monitor,3,ABC

6,3,3,Monitor,2,DEF

7,2,2,RAM,3,ABC

8,3,2,RAM,2,DEF

9,2,3,Monitor,2,ABC
Export a checked report 🔝
Export the report with the store labels as columns. The exported measures describe sale lines, units and sample revenue, rather than profit.
print(store_report.to_csv(index=False).rstrip())
assert store_report["sale_lines"].sum() == 9
# Optional report export:
# store_report.to_csv("store_sales_report.csv", index=False)
Expected output
store,sale_lines,units,revenue

ABC,5,13,1020

DEF,4,7,565
Common questions 🔝
Are the prices live? No; this is synthetic practice data. Can I derive profit? No; costs are not provided. Can I analyze trends? Add valid dates and define the period first. Why retain IDs? They link tables and distinguish records with similar names. Why did a join increase row count? Check duplicate lookup keys and the join relationship. Should I join on product text? Use the intended product ID and inspect description differences. Continue with sales exercises, pivot tables and DataFrames.
Exercise: summarize Monitor sales 🔝
Select product ID 3 and calculate the number of sale lines, total units and sample revenue. Predict the results before running the solution.
Exercise solution 🔝
Monitor appears in five sale lines, with twelve units and revenue 900.
monitor = enriched.loc[enriched["p_id"].eq(3)]
print(monitor[["sale_id", "qty", "revenue"]])
print("Lines:", len(monitor), "Units:", monitor["qty"].sum(), "Revenue:", monitor["revenue"].sum())
assert len(monitor) == 5
assert monitor["qty"].sum() == 12
assert monitor["revenue"].sum() == 900
Expected output
   sale_id  qty  revenue
0        1    2      150
2        3    3      225
4        5    3      225
5        6    2      150
8        9    2      150
Lines: 5 Units: 12 Revenue: 900
Practice in Google Colab 🔝
Open in Google Colab View on GitHub
Run the examples in order, change quantities and product IDs, then inspect joins, review records and report totals. Save your own copy to keep edits. All sample tables are included in the notebook.
Reference: Pandas DataFrame.merge documentation.

Subhendu Mohapatra
Author & Instructor at plus2net
I write and maintain practical tutorials on Python, PHP, SQL, JavaScript, HTML, jQuery, and web development at plus2net. The tutorials focus on clear explanations, working examples, and code that readers can test and adapt while learning.


Subscribe to our YouTube Channel here

 Python Video Tutorials