Pandas DataFrame: Architecture, Construction, and Core Operations
The pandas.DataFrame is the primary tabular data structure in Python. It represents a two-dimensional, size-mutable, and heterogeneous tabular data structure with labeled axes (rows and columns). Whether importing spreadsheets, executing SQL queries, or preparing features for machine learning, the DataFrame is the foundation of data manipulation in Pandas.
DataFrame Architecture & Anatomy 🔝
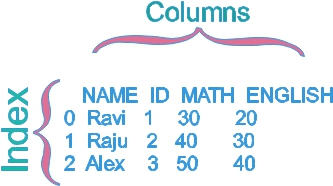
A DataFrame consists of three integrated components: data values (stored in contiguous NumPy arrays or extension arrays), an Index (row labels along axis 0), and Columns (field labels along axis 1). Unlike homogeneous NumPy matrices, individual columns in a DataFrame can hold distinct data types (integers, floats, strings, booleans, and datetimes) while sharing a aligned index.
Creating DataFrames from Dictionaries & NumPy Arrays 🔝
The most common constructor pattern passes a Python dictionary where keys represent column headers and values are lists of equal length:
import pandas as pd

# 1. Create DataFrame from a dictionary of lists
student_dict = {
    "NAME": ["Ravi", "Raju", "Alex"],
    "ID": [1, 2, 3],
    "MATH": [30, 40, 50],
    "ENGLISH": [20, 30, 40]
}

df_students = pd.DataFrame(data=student_dict)
print(df_students)
Output:
   NAME  ID  MATH  ENGLISH
0  Ravi   1    30       20
1  Raju   2    40       30
2  Alex   3    50       40
You can also construct a DataFrame from a NumPy 2D array by providing explicit column names:
import numpy as np

matrix = np.array([[10, 20], [30, 40], [50, 60]])
df_from_np = pd.DataFrame(matrix, columns=["Metric_A", "Metric_B"])
print(df_from_np)
Creating DataFrames from Strings & StringIO 🔝
When writing tests or prototyping without external disk files, ingest delimited text strings directly using Python\'s io.StringIO and pd.read_csv():
from io import StringIO
import pandas as pd

raw_csv_text = StringIO("""col1;col2;col3
1;5.40;Geek
2;43.25;Ravi
3;41.70;Ron
4;34.20;Alex
""")

df_string = pd.read_csv(raw_csv_text, sep=";")
print(df_string)
assert df_string.shape == (4, 3)
Managing Row Indices: Labels, RangeIndex & set_index() 🔝
By default, Pandas assigns a zero-based RangeIndex (0, 1, 2, ...). You can replace the default index with custom numeric labels or string identifiers:
# Assign explicit numeric labels
df_students.index = [101, 102, 103]
print(df_students)

# Assign string keys
df_students.index = ["student_a", "student_b", "student_c"]
print(df_students)

# Promote an existing column into the row index
df_indexed = df_students.set_index("ID")
print(df_indexed)
Read more on indexing workflows in the dedicated set_index() and reset_index() guide →
Column Manipulation & Subset Selection 🔝
Retrieve column names as a Pandas Index object via df.columns, or convert it to a standard Python list. To select multiple columns, pass a list of column names inside outer indexing brackets:
# 1. Inspect column names
col_names = df_students.columns.tolist()
print("Columns:", col_names)

# 2. Select specific column subsets
sub_df = df_students[["NAME", "ID"]]
print(sub_df)

# 3. Dynamic exclusion: select all columns except a specific field
display_cols = [c for c in df_students.columns if c != "ID"]
print(df_students[display_cols])
More details on renaming, adding, and rearranging columns can be found in the DataFrame Columns guide →
Row Slicing & Row Count Inspection 🔝
You can slice contiguous rows using positional slice syntax, inspect boundary rows with head(), or evaluate row counts:
# Positional slice (first 2 rows)
print(df_students[0:2])

# Inspect first row only
print(df_students[:1])

# Total number of rows
row_count = len(df_students.index)
print(f"Total Rows: {row_count}")
assert row_count == 3
Essential DataFrame Attributes 🔝
Pandas exposes quick inspection properties to audit structure and memory footprints:
| Attribute | Type | Description |
|---|---|---|
df.shape | Tuple | Dimensions in (rows, columns) format. |
df.dtypes | Series | Data type of each column. |
df.size | Integer | Total number of elements (rows × columns). |
df.ndim | Integer | Number of axes (always 2 for DataFrame). |
df.empty | Boolean | True if DataFrame contains zero rows. |
df.values | NumPy ndarray | Underlying raw NumPy matrix representation. |
Explore all available properties in the DataFrame Attributes reference → and operation functions in the DataFrame Methods directory →
Hands-on Exercise: Product Inventory Tracker 🔝
Create a product catalog DataFrame with 4 items: columns [\"sku\", \"product\", \"category\", \"price\", \"stock\"]. Assign sku as the index, filter for products priced over 50, and calculate total inventory value (price * stock).
import pandas as pd

inventory_data = {
    "sku": ["SKU-101", "SKU-102", "SKU-103", "SKU-104"],
    "product": ["Wireless Mouse", "Mechanical Keyboard", "USB Hub", "Monitor Stand"],
    "category": ["Accessories", "Peripherals", "Accessories", "Furniture"],
    "price": [24.99, 89.50, 15.00, 65.00],
    "stock": [50, 20, 100, 15]
}

df_inv = pd.DataFrame(inventory_data).set_index("sku")
df_inv["total_val"] = df_inv["price"] * df_inv["stock"]

premium_items = df_inv[df_inv["price"] > 50]
print("Premium Products (Price > $50):\n", premium_items[["product", "price", "total_val"]])

assert len(premium_items) == 2
assert "Mechanical Keyboard" in premium_items["product"].values
print(f"Total Catalog Value: ${df_inv[\'total_val\'].sum():.2f}")
Practice in Google Colab & GitHub 🔝
Open in Google Colab View on GitHub
Experiment with DataFrame constructors, index reassignment, column subsets, and inventory tracking calculations interactively in Google Colab.
More Details & Related Tutorials 🔝
- Pandas Section Overview — Complete guide to the Pandas data science ecosystem.
- Sample Student DataFrame — 35-row benchmark dataset used across tutorial examples.
- DataFrame Attributes — Detailed directory of structural inspection properties.
- DataFrame Methods — Core built-in functions for manipulating tables.
- loc & iloc Indexing — Label-based and integer-based row and column selection.
- set_index() & reset_index() — Setting, restoring, and converting row index axes.
- DataFrame Exercise 1 — Hands-on queries and solutions using the student dataset.

Subhendu Mohapatra
Author & Instructor at plus2net
I write and maintain practical tutorials on Python, PHP, SQL, JavaScript, HTML, jQuery, and web development at plus2net. The tutorials focus on clear explanations, working examples, and code that readers can test and adapt while learning.


Subscribe to our YouTube Channel here

 Python Video Tutorials