get_as_df() :Google sheets to Pandas DataFrame

Collect the data from google sheets and create Pandas DataFrame.
get_as_df(has_header=True, index_column=None,
 start=None, end=None, numerize=True, empty_value='',
 value_render=FORMATTED_VALUE | UNFORMATTED_VALUE | FROMULA, **kwargs)
get_as_df() to create Pandas DataFrame using data from Google sheet with options for index, header
| Options | Details |
|---|---|
| has_header | Default is True , Interpret first row as DataFrame header |
| index_column | Column to use as df index ( integer ) |
| numerize | Numerize cell values |
| empty_value | Placeholder value when cell is empty |
| start | Default A1, top left cell address ( as tuple ) to use as DataFrame |
| end | Default ( rows , cols) , Bottom right cell address ( as tuple ) to use as DataFrame |
| value_render | Default ( string) FORMATTED_VALUE | UNFORMATTED_VALUE | FORMULA |
| include_tailing_empty | After last non-zero value in a row , whether to include trailing cells/value |
| include_tailing_empty_rows | whether to include tailing rows with no values |
Pygsheets and google API authorization Pandas DataFrame
Here is the code to create DataFrame using google sheet.
import pygsheets
path='G:\\My drive\\testing\\google-sheet\\creds1.json'
gc=pygsheets.authorize(service_account_file=path)#Authorize to connect
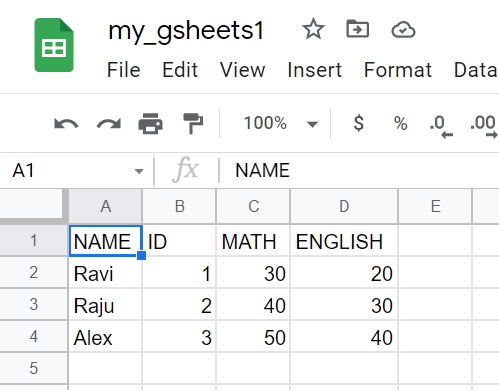
sh=gc.open('my_gsheets1') # Open google sheet
wk1=sh[0] # first worksheet
wk1.resize(10,10) # resize rows and columns of sheet
df = wk1.get_as_df() # create the dataframe
print(df) # Display DataFrame
print(df.count()) # Row and column details of the DataFrame. NAME ID MATH ENGLISH
0 Ravi 1 30 20
1 Raju 2 40 30
2 Alex 3 50 40
NAME 3
ID 3
MATH 3
ENGLISH 3
dtype: int64has_header
Default value for this Option is True. The first row is used as column header for the created DataFrame.df = wk1.get_as_df(has_header=False) # create the dataframe
print(df) # Display 0 1 2 3
0 NAME ID MATH ENGLISH
1 Ravi 1 30 20
2 Raju 2 40 30
3 Alex 3 50 40index_column
We can specify which column is to be used as index.df = wk1.get_as_df(index_column=2) NAME MATH ENGLISH
ID
1 Ravi 30 20
2 Raju 40 30
3 Alex 50 40df = wk1.get_as_df(index_column=1) # create the dataframe ID MATH ENGLISH
NAME
Ravi 1 30 20
Raju 2 40 30
Alex 3 50 40numerize
By default the value ofnumerize=True. It will numerize the cell value. We changed C3 cell value. 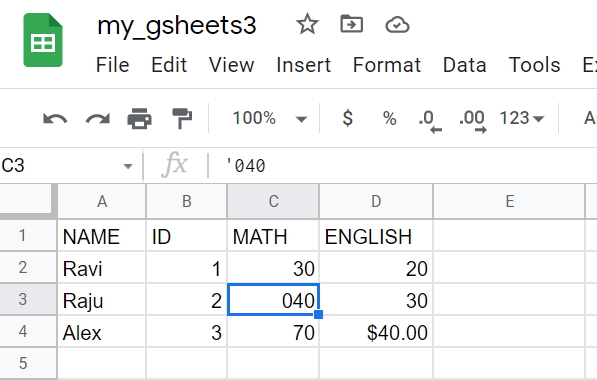
df = wk1.get_as_df(numerize=False) NAME ID MATH ENGLISH
0 Ravi 1 30 20
1 Raju 2 040 30
2 Alex 3 70 $40.00df = wk1.get_as_df(numerize=True) NAME ID MATH ENGLISH
0 Ravi 1 30 20
1 Raju 2 40 30
2 Alex 3 70 $40.00value_render
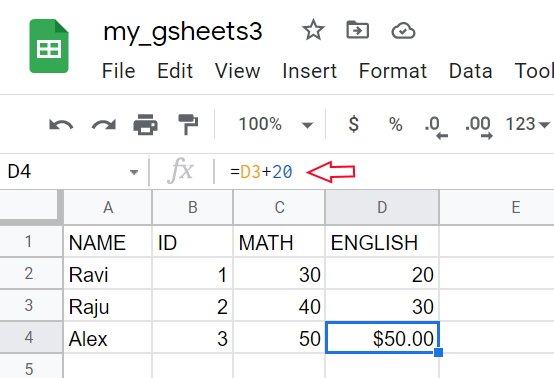
This will add the format or remove the format or only use the formual.We have formatted the cell D4 to add Price ( $50 ) , watch the formula we used at D4 cell below.
df = wk1.get_as_df(value_render='FORMATTED_VALUE') #the dataframe NAME ID MATH ENGLISH
0 Ravi 1 30 20
1 Raju 2 40 30
2 Alex 3 50 $50.00df = wk1.get_as_df(value_render='UNFORMATTED_VALUE') NAME ID MATH ENGLISH
0 Ravi 1 30 20
1 Raju 2 40 30
2 Alex 3 50 50df = wk1.get_as_df(value_render='FORMULA') NAME ID MATH ENGLISH
0 Ravi 1 30 20
1 Raju 2 40 30
2 Alex 3 50 =D3+20include_tailing_empty_rows
We will add count() to read number of rows and columns in our DataFrame.sh=gc.open('my_gsheets3')
wk1=sh[0] # first worksheet
wk1.resize(10,10) # resize rows and columns of sheet
df = wk1.get_as_df(include_tailing_empty_rows=True) #the dataframe
print(df) # Display
print(df.count())wk1.resize(10,10) so all the blank cells are added and it is showing 9 rows of data ( excluding header row )
   NAME  ID  MATH ENGLISH
0  Ravi   1    30      20
1  Raju   2    40      30
2  Alex   3    50  $50.00
3
4
5
6
7
8
NAME 9
ID 9
MATH 9
ENGLISH 9
dtype: int64df = wk1.get_as_df(include_tailing_empty_rows=False) #the dataframe NAME ID MATH ENGLISH
0 Ravi 1 30 20
1 Raju 2 40 30
2 Alex 3 50 $50.00
NAME 3
ID 3
MATH 3
ENGLISH 3
dtype: int64empty_value
Placeholder value to represent empty cells when numerizing. ( Note: by defaultnumerize=True). We changed the value at google sheet like this by keeping some blanks. 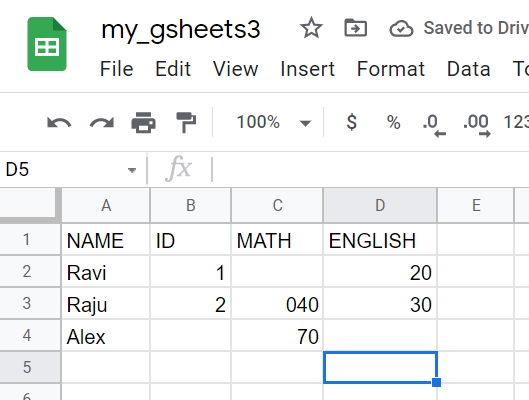
df = wk1.get_as_df( empty_value='#') NAME ID MATH ENGLISH
0 Ravi 1 # 20
1 Raju 2 40 30
2 Alex # 70 #df = wk1.get_as_df(numerize=False,empty_value='#') NAME ID MATH ENGLISH
0 Ravi 1 20
1 Raju 2 040 30
2 Alex 70 #
Subhendu Mohapatra
Author
🎥 Join me live on YouTubePassionate about coding and teaching, I publish practical tutorials on PHP, Python, JavaScript, SQL, and web development. My goal is to make learning simple, engaging, and project‑oriented with real examples and source code.
Subscribe to our YouTube Channel here
This article is written by plus2net.com team.
https://www.plus2net.com

 Python Video Tutorials