Drawing Sin & Cos Curve using PHP GD Support
We will declare some variables.
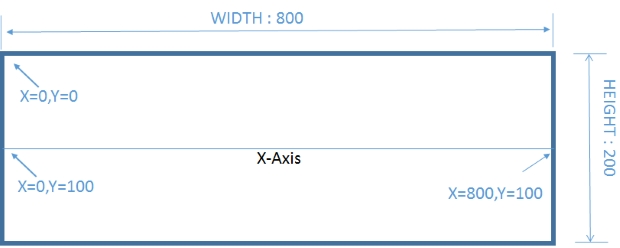
$width=800;  // Width of the Image Canvas
$height=200; // Height of the canvas
$steps=2;     // The Jump in value of X - Axis for each loop.
$x2=$x1+ $stepsNo of loops required.
To draw the curve we will use the loop and the loop will take one upper limit which is taken from this formula.for($i=1;$i<=($width/$steps);$i++){How the curve is drawn
We used one for loop to draw lines between two coordinates. To draw this line we will use imageline function which takes two coordinates to draw line between them.On next iteration of the loop, the 1st coordinate takes the values of 2nd coordinate of previous iteration of the loop.
For example in one loop the first coordinate is x1=20,y1=25 . Our 2nd Coordinate is x2=23,y2=27. IN the next loop we will have x1=23,y1=27, so the line will start from where we left at previous loop.
$x1=$x2;So our curve will reach its peak at SIN(90) which should be within our top of the image. So we will use one multiplier to adjust the height of the curve.
$y1=($height/2)-number_format(sin(deg2rad($x1))*90,0);DEMO of SIN curve using PHP GD The complete code is here.
<?Php
header("Content-type: image/jpg");
$width=800;  // Width of the Image Canvas
$height=200; // Height of the canvas
$steps=2;     // The Jump in value of X - Axis for each loop.

$x1=0;

$im = @ImageCreate ($width, $height)
or die ("Cannot Initialize new GD image stream");
$background_color = ImageColorAllocate ($im, 244, 244, 244); // Assign background color
$text_color = ImageColorAllocate ($im, 51, 51, 255); // text color is given
imageline ( $im , 0 , $height/2 , $width , $height/2 , 245 ); // X axis

for($i=1;$i<=($width/$steps);$i++){

$y1=($height/2)-number_format(sin(deg2rad($x1))*90,0);
$x2=$x1+$steps;

$y2=($height/2)-number_format(sin(deg2rad($x2))*90,0);

imageline ( $im , $x1 , $y1 , $x2 , $y2 , $text_color );

$x1=$x2;
}

ImagePng ($im); // image displayed
?>
Drawing COS curve
In your editor just search and replace sin with cos. Your cos curve is ready.$y1=($height/2)-number_format(cos(deg2rad($x1))*90,0);
$x2=$x1+$steps;
$y2=($height/2)-number_format(cos(deg2rad($x2))*90,0);
We can draw both curves SIN and COS in a single image. We have added thickness of the curve, text at X axis to the script. Here is the demo
DEMO of both SIN & COS curve
<?Php
header("Content-type: image/jpg");
$width=800;
$height=200;
$steps=2;     // The Jump in value of X - Axis for each loop.

$x1=$a1=0;

$im = @ImageCreate ($width, $height)
or die ("Cannot Initialize new GD image stream");
$background_color = ImageColorAllocate ($im, 204, 204, 204); // Assign background color
$text_color = ImageColorAllocate ($im, 51, 51, 255); // text color is given
$text_color1 = ImageColorAllocate ($im, 0, 0, 0); // text color is given
imagesetthickness ( $im , 2 );// manage thinkness of the curve.
imageline ( $im , 0 , $height/2 , $width , $height/2 , 245 ); // X axis

imagesetthickness ( $im , 1 );// manage thinkness of the curve.

for($i=1;$i<=($width/$steps);$i++){

$y1=($height/2)-number_format(cos(deg2rad($x1))*100,0);
$b1=($height/2)-number_format(sin(deg2rad($a1))*100,0);
$x2=$x1+$steps;
$a2=$a1+$steps;

$y2=($height/2)-number_format(cos(deg2rad($x2))*100,0);
$b2=($height/2)-number_format(sin(deg2rad($a2))*100,0);
//$y2=30;

imageline ( $im , $x1 , $y1 , $x2 , $y2 , $text_color );
imageline ( $im , $a1 , $b1 , $a2 , $b2 , $text_color1 );
if($y2==100){ImageString($im,15,$x2+5,$y2,$x2,$text_color); } // Text on X -Axis

$x1=$x2;
$a1=$a2;
}

ImagePng ($im); // image displayed
?>GD functions

Subhendu Mohapatra
Author
🎥 Join me live on YouTubePassionate about coding and teaching, I publish practical tutorials on PHP, Python, JavaScript, SQL, and web development. My goal is to make learning simple, engaging, and project‑oriented with real examples and source code.
Subscribe to our YouTube Channel here
This article is written by plus2net.com team.
https://www.plus2net.com