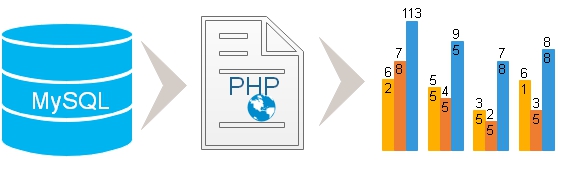
Column Chart using data from MySQL table by PHP
| File Name | Details |
|---|---|
| config.php | MySQLi Database connection details are stored here. |
| sql_dump.txt | SQL Dump to create chart_data_column table with sample data. |
| readme.txt | Instructions on how to run the script |
| index.php | The main file to display records and the Column /bar chart. |
| File Name | Details |
|---|---|
| config-pdo.php | PDO Database connection details are stored here. |
| index-pdo.php | Using PDO the main file to display column / bar Chart. |
| File Name | Details |
|---|---|
| index-csv.php | Reading CSV file by using fgetcsv() and display chart. |
| chart_data_column.csv | Comma separated value ( csv ) file with data. |
Download Zip file at end of this tutorial.
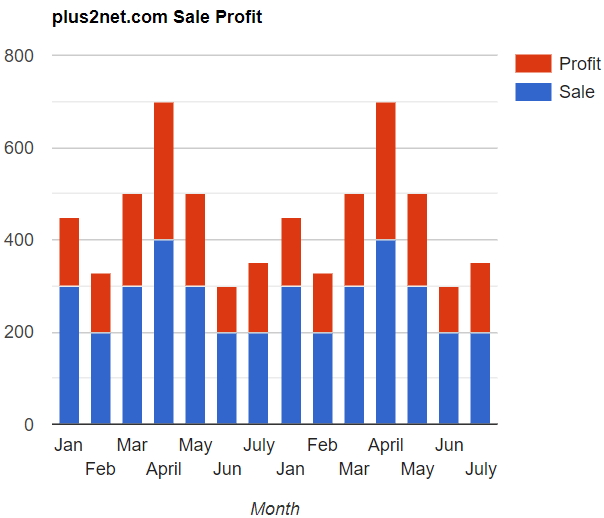
Column Chart : Orientation is vertical
Bar Chart : Orientation is horizontal
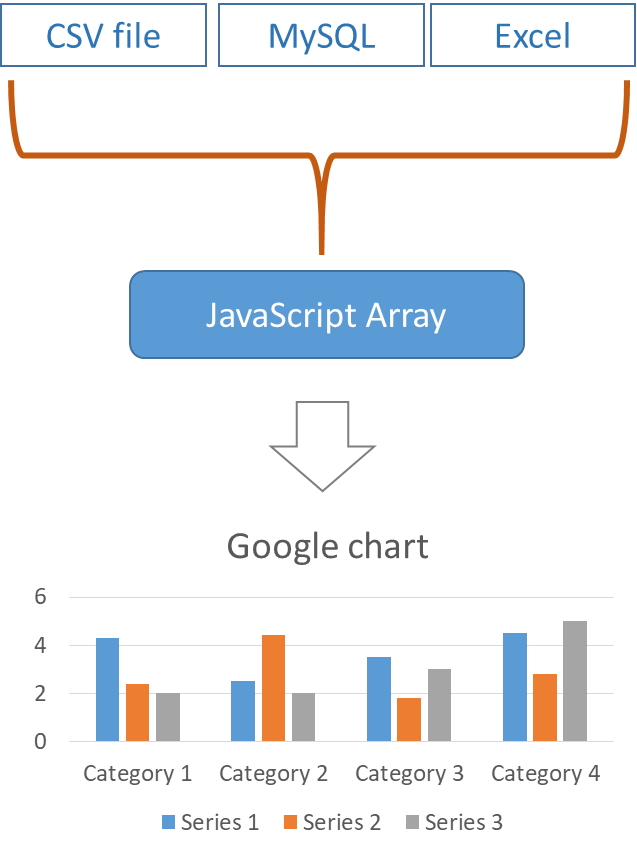
Column & Bar Chart with data from MySQL database table using PHP pdo and google chart library
Sample column Chart in html
Without using PHP or MySQL, you can try this simple HTML and JavaScript code to display the above column chart. Copy this code and save ( open ) as HTML file. Google Chart library is also included inside the code.1 : Collecting data from MySQL database
After connecting to database through config.php file, we will run the SQL to collect the data from MySQL table. You can read more on MySQLi and how to collect data from table.if($stmt = $connection->query("SELECT month,sale,profit FROM chart_data_column")){
echo "No of records : ".$stmt->num_rows."<br>";
$php_data_array = Array(); // create PHP array
echo "<table>
<tr> <th>Month</th><th>Sale</th><th>Profit</th></tr>";
while ($row = $stmt->fetch_row()) {
echo "<tr><td>$row[0]</td><td>$row[1]</td><td>$row[2]</td></tr>";
$php_data_array[] = $row; // Adding to array
}
echo "</table>";
}else{
echo $connection->error;
}Any one method either MySQLi ( Above code ) or PDO ( Below code ) is to be used to collect data and create the JavaScript array.
Both scripts are available inside zip file at the end of this page.
Both scripts are available inside zip file at the end of this page.
<?Php
require "config-pdo.php";// Database connection
$query="SELECT month,sale,profit FROM chart_data_column";
$step = $dbo->prepare($query);
if($step->execute()){
$php_data_array = $step->fetchAll(); //
echo "<script>
        var my_2d = ".json_encode($php_data_array)."
</script>";
}
?>
2 : Data array in PHP
Before displaying records in a table we have created an array in PHP ($php_data_array). While displaying the records in a table we store each record inside the PHP array.
$php_data_array[] = $row; // Adding to array$php_data_array with all the data collected from MySQL table. We can display the Json string like this.
echo json_encode($php_data_array); We created the PHP array
$php_data_array by using MySQL database as source. Once the php array is created the rest of the code remain same. Below you can find code to create this $php_data_array by using csv file as source. 3 : Transferring data from PHP to JavaScript to create the chart
By using json_encode we will create an json string which can be used to create the JavaScript two dimensional array.
echo "<script>
        var my_2d = ".json_encode($php_data_array)."
</script>";
4 : Adding data to Chart
Our JavaScript arraymy_2d stores all the data required for creating the chart. We need to display them in the format required by our Chart library.
for(i = 0; i < my_2d.length; i++)
data.addRow([my_2d[i][0], parseInt(my_2d[i][1]),parseInt(my_2d[i][2])]);<script type="text/javascript" src="https://www.gstatic.com/charts/loader.js"></script>
<script type="text/javascript">
// Load the Visualization API and the corechart package.
google.charts.load('current', {packages: ['corechart', 'bar']});
google.charts.setOnLoadCallback(drawChart);
function drawChart() {
// Create the data table.
var data = new google.visualization.DataTable();
data.addColumn('string', 'Month');
data.addColumn('number', 'Sale');
data.addColumn('number', 'Profit');
for(i = 0; i < my_2d.length; i++)
data.addRow([my_2d[i][0], parseInt(my_2d[i][1]),parseInt(my_2d[i][2])]);
var options = {
title: 'plus2net.com Sales Profit',
hAxis: {title: 'Month', titleTextStyle: {color: '#333'}},
vAxis: {minValue: 0}
};
var chart = new google.visualization.ColumnChart(document.getElementById('chart_div'));
chart.draw(data, options);
}
///////////////////////////////
////////////////////////////////////
</script>Updating colours
We can add more options ( from above code ) here var options = {
title: 'plus2net.com Sale Profit',
hAxis: {title: 'Month', titleTextStyle: {color: '#333'}},
vAxis: {minValue: 0},
height:400,
width:900,
colors: ['#2596be', '#f6c7b6'],
};5. HTML part
We can show the chart inside a <DIV> tag and place the same any where we want to display the chart.<div id="chart_div"></div>The chart drawn above can be displayed with live internet connection as the library is to be loaded from gstatic.com
Data is collected from MySQL database table so data can be edited by using script and the same will be reflected by the Chart. We have not included this part in the present script and there are many tutorials available here one handling data using PHP and MySQL.
You can read tutorials on other types of charts displayed by using data from database.Stacked Column chart
var options = {
          title: 'plus2net.com Sale Profit',
          hAxis: {title: 'Month',  titleTextStyle: {color: '#333'}},
          vAxis: {minValue: 0},
		  height:400,
		  width:480,
		  isStacked:true
        };
Bar Chart
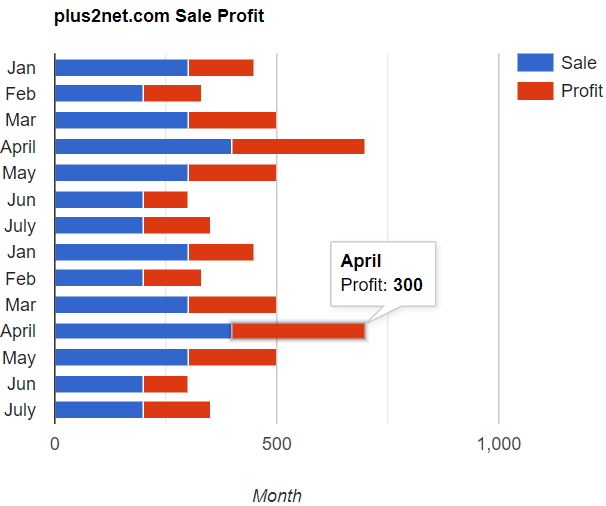
Change this line
/*
var chart =
	new google.visualization.ColumnChart(document.getElementById('chart_div'));
*/
var chart =
	new google.visualization.BarChart(document.getElementById('chart_div'));
Using CSV file as data source
Once the php aray$php_data_array is created the rest of the code remain same. Here we are reading the chart_data_column.csv file to create the $php_data_array. Once the array is created same code can be used. Zip file below contains the chart_data_column.csv file as data source and the index-csv.php file to display the chart. We used fgetcsv() to read csv file
$f_pointer=fopen("chart_data_column.csv","r"); // file pointer
$php_data_array = Array(); // create PHP array
while(! feof($f_pointer)){
$ar=fgetcsv($f_pointer);
//echo print_r($ar); // print the array
$php_data_array[] = $ar; // Adding to array
}
print_r($php_data_array);
echo "<script>
var my_2d=".json_encode($php_data_array)."
</script>";Pie Chart using MySQL database table Charts understanding Charts Pie Chart
Line Chart using data from MySQL table Tutorial on using MySQL records to display in Google table chart.

Subhendu Mohapatra
Author
🎥 Join me live on YouTubePassionate about coding and teaching, I publish practical tutorials on PHP, Python, JavaScript, SQL, and web development. My goal is to make learning simple, engaging, and project‑oriented with real examples and source code.
Subscribe to our YouTube Channel here
This article is written by plus2net.com team.
https://www.plus2net.com