Insert Images & Charts into Excel using OpenPyXL (Python)
This tutorial shows how to insert images and charts into an Excel sheet using
openpyxl.
You will learn:
- How to add an image into any cell
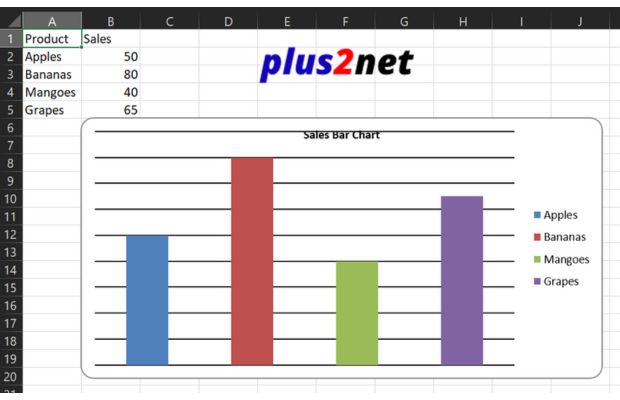
- How to create a Bar Chart using Excel formulas
- How to save & view your final Excel output
Add Images and Charts to Excel using Python (openpyxl Tutorial at Colab platform)
Install openpyxl
pip install openpyxl pillowAdding Image to Excel file
Add image by selecting the path or in a cloud platform like Colab we can upload or pull the image from the URL.# ==== INSERT IMAGE ====
# In Google Colab: download image from URL
!wget https://www.plus2net.com/images/top2.png
from openpyxl.drawing.image import Image
# Insert image into Excel sheet
img = Image("top2.png")
ws.add_image(img, "E2") # Insert image starting from cell E2✅ Example: Insert Image + Bar Chart into Excel
Save this as openpyxl-images-charts.py and run.
from openpyxl import Workbook
from openpyxl.drawing.image import Image
from openpyxl.chart import BarChart, Reference

wb = Workbook()
ws = wb.active
ws.title = "Sales Data"

# sample data
ws.append(["Product", "Sales"])
ws.append(["Apples", 50])
ws.append(["Bananas", 80])
ws.append(["Mangoes", 40])
ws.append(["Grapes", 65])

# ==== INSERT IMAGE ====
!wget https://www.plus2net.com/images/top2.png   # download image in Colab (skip if image is already saved)
img = Image("top2.png")
ws.add_image(img, "E2")

# ==== CREATE CHART ====
chart = BarChart()
chart.title = "Sales Bar Chart"

data = Reference(ws, min_col=2, min_row=1, max_row=5)
labels = Reference(ws, min_col=1, min_row=2, max_row=5)

chart.add_data(data, titles_from_data=True)
chart.set_categories(labels)

ws.add_chart(chart, "B6")

file_path = "my_file.xlsx"
wb.save(file_path)
print("Excel file created:", file_path)
Tip: PNG, JPG, and BMP images are supported. Resize images before inserting for best results.
Optional Enhancements
- Style chart colors
- Add axes labels
- Insert multiple charts in the same Excel file
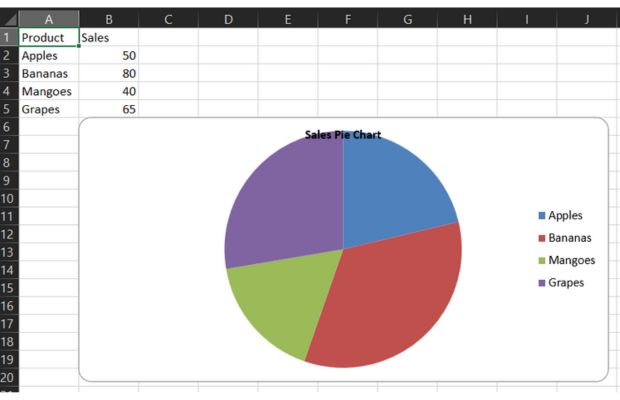
Pie Chart by using OpenPyXL
from openpyxl import Workbook
from openpyxl.chart import PieChart, Reference

wb = Workbook()
ws = wb.active
ws.title = "Sales Data"

# sample data
ws.append(["Product", "Sales"])
ws.append(["Apples", 50])
ws.append(["Bananas", 80])
ws.append(["Mangoes", 40])
ws.append(["Grapes", 65])

# ==== CREATE CHART ====
chart = PieChart()
chart.title = "Sales Pie Chart"

data = Reference(ws, min_col=2, min_row=1, max_row=5)
labels = Reference(ws, min_col=1, min_row=2, max_row=5)

chart.add_data(data, titles_from_data=True)
chart.set_categories(labels)

ws.add_chart(chart, "B6") # chart positioned at B6

#file_path = "D:\\testing3\\openpyxl\\output.xlsx"
file_path = "my_file.xlsx"
wb.save(file_path)
print("Excel file created:", file_path)
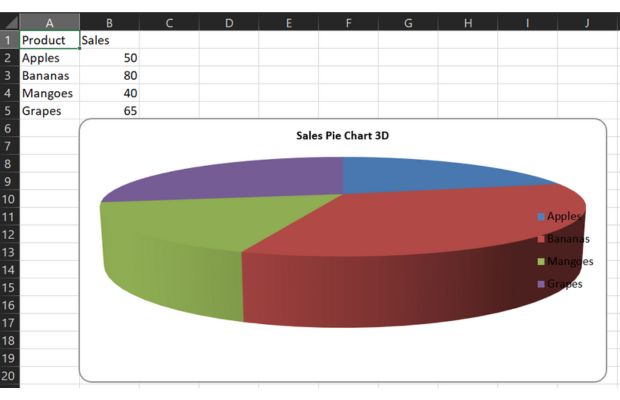
3D Pie Chart by using OpenPyXL
from openpyxl import Workbook
from openpyxl.drawing.image import Image
from openpyxl.chart import PieChart3D, Reference
wb = Workbook()
ws = wb.active
ws.title = "Sales Data"
# sample data
ws.append(["Product", "Sales"])
ws.append(["Apples", 50])
ws.append(["Bananas", 80])
ws.append(["Mangoes", 40])
ws.append(["Grapes", 65])
# ==== CREATE CHART ====
chart = PieChart3D()
chart.title = "Sales Pie Chart 3D"
data = Reference(ws, min_col=2, min_row=1, max_row=5)
labels = Reference(ws, min_col=1, min_row=2, max_row=5)
chart.add_data(data, titles_from_data=True)
chart.set_categories(labels)
ws.add_chart(chart, "B6") # chart positioned at B6
#file_path = "D:\\testing3\\openpyxl\\output.xlsx"
file_path = "my_file.xlsx"
wb.save(file_path)
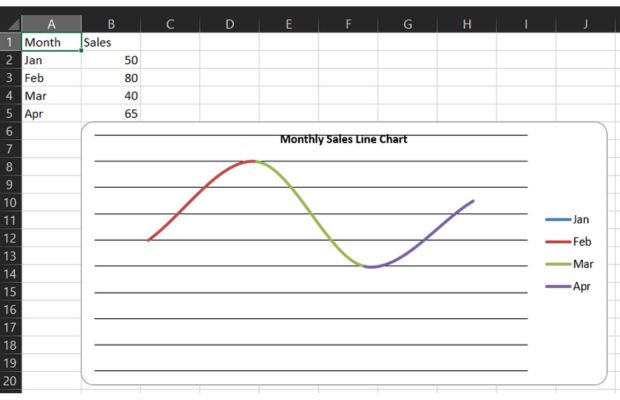
print("Excel file created:", file_path)Line chart by using OpenPyXL
from openpyxl import Workbook
from openpyxl.chart import LineChart, Reference
wb = Workbook()
ws = wb.active
ws.title = "Sales Data"
# sample data
ws.append(["Month", "Sales"])
ws.append(["Jan", 50])
ws.append(["Feb", 80])
ws.append(["Mar", 40])
ws.append(["Apr", 65])
# ==== CREATE CHART ====
chart = LineChart()
chart.title = "Monthly Sales Line Chart"
data = Reference(ws, min_col=2, min_row=1, max_row=5)
labels = Reference(ws, min_col=1, min_row=2, max_row=5)
chart.add_data(data, titles_from_data=True)
chart.set_categories(labels)
ws.add_chart(chart, "B6") # chart top left edge at B6
file_path = "my_line_chart_file.xlsx"
wb.save(file_path)
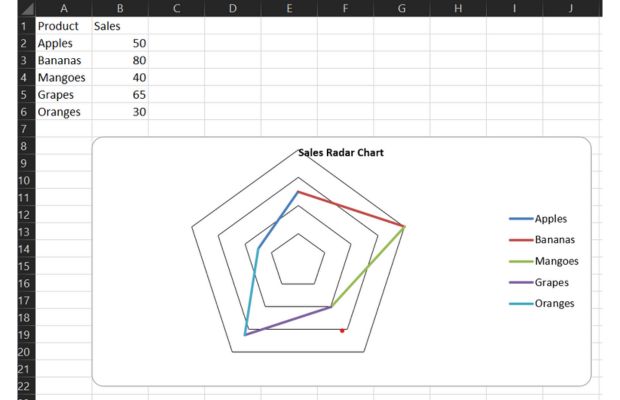
print("Excel file created:", file_path)Radar Chart by using OpenPyXL
from openpyxl import Workbook
from openpyxl.chart import RadarChart, Reference
wb = Workbook()
ws = wb.active
ws.title = "Sales Data"
# sample data
ws.append(["Product", "Sales"])
ws.append(["Apples", 50])
ws.append(["Bananas", 80])
ws.append(["Mangoes", 40])
ws.append(["Grapes", 65])
ws.append(["Oranges", 30])
# ==== CREATE CHART ====
chart = RadarChart()
chart.title = "Sales Radar Chart"
data = Reference(ws, min_col=2, min_row=1, max_row=6)
labels = Reference(ws, min_col=1, min_row=2, max_row=6)
chart.add_data(data, titles_from_data=True)
chart.set_categories(labels)
ws.add_chart(chart, "B8") # chart positioned at B8
file_path = "my_radar_chart_file.xlsx"
wb.save(file_path)
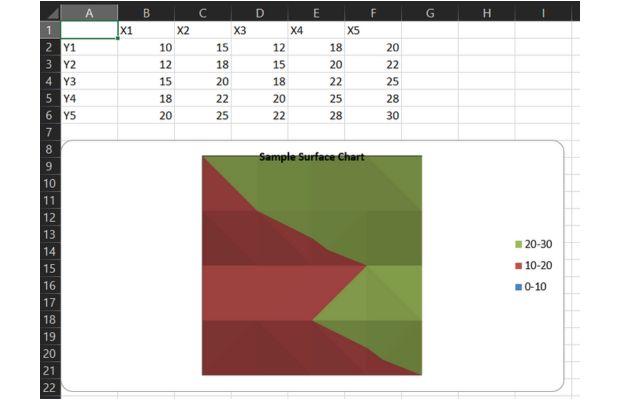
print("Excel file created:", file_path)Surface Chart by OpenPyXL
from openpyxl import Workbook
from openpyxl.chart import SurfaceChart, Reference

wb = Workbook()
ws = wb.active
ws.title = "Surface Data"

# Sample data for a Surface Chart (requires data in a grid format)
# This represents a simple 5x5 grid of values
data = [
    [None, 'X1', 'X2', 'X3', 'X4', 'X5'],
    ['Y1', 10, 15, 12, 18, 20],
    ['Y2', 12, 18, 15, 20, 22],
    ['Y3', 15, 20, 18, 22, 25],
    ['Y4', 18, 22, 20, 25, 28],
    ['Y5', 20, 25, 22, 28, 30],
]

for row_data in data:
    ws.append(row_data)

# ==== CREATE CHART ====
chart = SurfaceChart()
chart.title = "Sample Surface Chart"

# Define data range (excluding the first row and column which are labels)
values = Reference(ws, min_col=2, min_row=2, max_col=6, max_row=6)

# Add data series
chart.add_data(values)

# Define categories for X and Y axes
x_labels = Reference(ws, min_col=2, min_row=1, max_col=6, max_row=1)
y_labels = Reference(ws, min_col=1, min_row=2, max_col=1, max_row=6)

chart.set_categories(x_labels)
chart.set_categories(y_labels)

ws.add_chart(chart, "A8") # chart positioned at A8

file_path = "my_surface_chart_file.xlsx"
wb.save(file_path)
print("Excel file created:", file_path)
3D Surface chart

from openpyxl import Workbook
from openpyxl.chart import SurfaceChart3D, Reference

wb = Workbook()
ws = wb.active
ws.title = 'Surface Data'

# Sample data for a 3D Surface Chart (grid format)
data = [
    [None, 'X1', 'X2', 'X3', 'X4', 'X5'],
    ['Y1', 10, 15, 12, 18, 20],
    ['Y2', 12, 18, 15, 20, 22],
    ['Y3', 15, 20, 18, 22, 25],
    ['Y4', 18, 22, 20, 25, 28],
    ['Y5', 20, 25, 22, 28, 30],
]

for row_data in data:
    ws.append(row_data)

# ==== CREATE 3D SURFACE CHART ====
chart = SurfaceChart3D()
chart.title = 'Sample 3D Surface Chart'

# Data range (exclude labels)
values = Reference(ws, min_col=2, min_row=2, max_col=6, max_row=6)
chart.add_data(values)

# Define X & Y labels
x_labels = Reference(ws, min_col=2, min_row=1, max_col=6, max_row=1)
y_labels = Reference(ws, min_col=1, min_row=2, max_col=1, max_row=6)

chart.set_categories(x_labels)
chart.set_categories(y_labels)

ws.add_chart(chart, 'A8')  # Insert chart starting at cell A8

file_path = 'my_surface_chart_file3D.xlsx'
wb.save(file_path)
print("Excel file created:", file_path)
Download the above full source code from Github or run the code in your Google colab platform.
Adding Image and Charts to Excel by OpenPyXl
https://github.com/plus2net/Python-basics/blob/main/openpyxl_7_images_charts.ipynb
Adding Image and Charts to Excel by OpenPyXl
https://github.com/plus2net/Python-basics/blob/main/openpyxl_7_images_charts.ipynb
Read Excel Data ➜ Formatting & Styling ➜

Subhendu Mohapatra
Author
🎥 Join me live on YouTubePassionate about coding and teaching, I publish practical tutorials on PHP, Python, JavaScript, SQL, and web development. My goal is to make learning simple, engaging, and project‑oriented with real examples and source code.
Subscribe to our YouTube Channel here
This article is written by plus2net.com team.
https://www.plus2net.com

 Python Video Tutorials