Pandas Series: Labels, Values and Practical Calculations
A Pandas Series is a one-dimensional collection of values with index labels. It is the structure returned when you select a single DataFrame column. Learn how labels control selection and arithmetic, then use those ideas to build a product-price report.
Create a Series from a List
A Series has one dimension, an index of labels and a dtype for its values. A DataFrame has rows and columns. With no index argument, Pandas supplies labels 0, 1 and 2. The optional name identifies the Series; it does not replace the index.
import pandas as pd

s = pd.Series(["Ravi", "Raju", "Alex"], name="student")
print(s)
print("Dimensions:", s.ndim)
print("Name:", s.name)
assert s.ndim == 1
Expected output
0    Ravi
1    Raju
2    Alex
Name: student, dtype: str
Dimensions: 1
Name: student
Supply Your Own Index Labels
The index must have the same length as a list of values. Labels can be strings, integers or other hashable values and need not be unique. Unique labels are easier to use as lookup keys. Explicit labels help prevent confusion between labels and positions.
s = pd.Series(["Ravi", "Raju", "Alex"], index=["p", "q", "r"], name="student")
print(s)
print("Labels:", s.index.tolist())
assert s.loc["q"] == "Raju"
Expected output
p    Ravi
q    Raju
r    Alex
Name: student, dtype: str
Labels: ['p', 'q', 'r']
Use a Tuple; Order a Set Before Conversion
A tuple is ordered and can provide values directly. A set is unordered and cannot be passed directly as Series data. Convert it to an intentionally ordered list first. Sorting is suitable here because all values are comparable strings.
s = pd.Series(("Ravi", "Raju", "Alex"))
print("From tuple:")
print(s)
ordered = sorted({"Ravi", "Raju", "Alex"})
print("From sorted set:")
print(pd.Series(ordered))
Expected output
From tuple:
0    Ravi
1    Raju
2    Alex
dtype: str
From sorted set:
0    Alex
1    Raju
2    Ravi
dtype: str
Create from a Dictionary
Dictionary keys become index labels. If an index is supplied, Pandas selects matching keys in that index order. Unmatched keys become missing values. This is label selection, not positional selection. Review dictionary basics for key-value data.
data = {"a": "Ravi", "b": "Raju", "c": "Alex"}
print("All keys:")
print(pd.Series(data))
print("Selected keys:")
print(pd.Series(data, index=["a", "c"]))
print("Unmatched keys:")
print(pd.Series(data, index=["x", "y", "z"]))
Expected output
All keys:
a    Ravi
b    Raju
c    Alex
dtype: str
Selected keys:
a    Ravi
c    Alex
dtype: str
Unmatched keys:
x    NaN
y    NaN
z    NaN
dtype: str
Repeat a Scalar over an Index
A scalar value is broadcast to each supplied index label. This can initialise a flag or a default value when that default has a clear meaning. It should not turn genuinely unknown measurements into invented observations.
s = pd.Series("Alex", index=["x", "y", "z"], name="student")
print(s)
assert s.tolist() == ["Alex", "Alex", "Alex"]
Expected output
x    Alex
y    Alex
z    Alex
Name: student, dtype: str
Create a Series from a NumPy Array
A one-dimensional NumPy array can provide the values. A fixed random seed makes this example repeatable. Specify copy=True if you need an independent copy of input values; avoid relying on shared-array mutation behaviour across versions.
import numpy as np

rng = np.random.default_rng(42)
array = rng.random(4)
s = pd.Series(array, name="measurement", copy=True)
print(s.round(4))
assert len(s) == 4
Expected output
0    0.7740
1    0.4389
2    0.8586
3    0.6974
Name: measurement, dtype: float64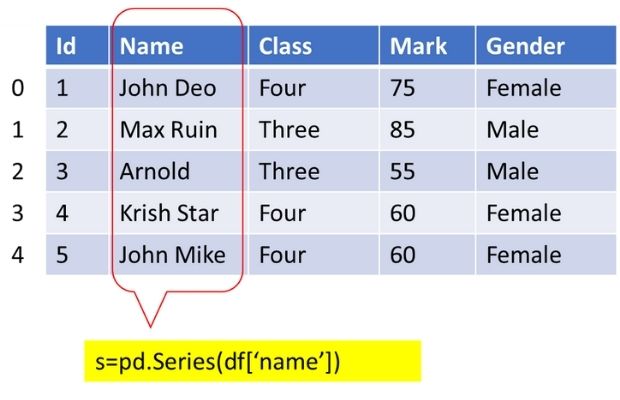
A DataFrame Column Is Already a Series
Selecting one column returns a Series; selecting a one-item column list returns a DataFrame. After using read_csv() or read_excel(), select a column in the same way. This embedded sample avoids needing a file and preserves the distinction between rows and columns.
def student_data():
    return pd.DataFrame({
        "id": [1, 2, 3, 4, 5, 6, 7],
        "name": ["John Deo", "Max Ruin", "Arnold", "Krish Star", "John Mike", "Alex John", "My John Rob"],
        "mark": [75, 85, 55, 60, 60, 55, 78]
    })

df = student_data()
s = df["name"]
print(s)
print(type(s).__name__)
print(type(df[["name"]]).__name__)
Expected output
0       John Deo
1       Max Ruin
2         Arnold
3     Krish Star
4      John Mike
5      Alex John
6    My John Rob
Name: name, dtype: str
Series
DataFrame
Store Row Lists as Series Values
Converting every row to a list creates a Series whose elements are lists. It does not flatten the table into a simple numeric column. Use a normal DataFrame for most tabular analysis. See DataFrame-to-list examples for conversion choices.
df = student_data()
s = pd.Series(df.to_numpy().tolist(), name="row_data")
print(s.head(3))
assert isinstance(s.iloc[0], list)
Expected output
0    [1, John Deo, 75]
1    [2, Max Ruin, 85]
2      [3, Arnold, 55]
Name: row_data, dtype: object
Preview with head and tail
head() returns the first rows; tail() returns the last rows. Both default to five. Use explicit positional slicing when the starting and stopping positions matter.
s = student_data()["name"]
print("First five:")
print(s.head())
print("First two:")
print(s.head(2))
print("Last five:")
print(s.tail())
print("Last two:")
print(s.tail(2))
assert s.iloc[:5].equals(s.head())
Expected output
First five:
0      John Deo
1      Max Ruin
2        Arnold
3    Krish Star
4     John Mike
Name: name, dtype: str
First two:
0    John Deo
1    Max Ruin
Name: name, dtype: str
Last five:
2         Arnold
3     Krish Star
4      John Mike
5      Alex John
6    My John Rob
Name: name, dtype: str
Last two:
5      Alex John
6    My John Rob
Name: name, dtype: str
Select Positions with iloc
iloc is an indexer used with square brackets. The stop position is excluded. iloc[3:7] selects positions 3, 4, 5 and 6. iloc[::2] selects alternate positions starting at 0.
s = student_data()["name"]
print("Positions 3 through 6:")
print(s.iloc[3:7])
print("Alternate positions:")
print(s.iloc[::2])
print("First two index labels:", s.iloc[:2].index.tolist())
print("First two values:", s.iloc[:2].tolist())
Expected output
Positions 3 through 6:
3     Krish Star
4      John Mike
5      Alex John
6    My John Rob
Name: name, dtype: str
Alternate positions:
0       John Deo
2         Arnold
4      John Mike
6    My John Rob
Name: name, dtype: str
First two index labels: [0, 1]
First two values: ['John Deo', 'Max Ruin']
Select Labels with loc
loc selects index labels. With integer labels, s[0] looks for label 0; it should not be used to express an intended first-position lookup. Use iloc[0] for the first position. Label slices on this ordered index include the stop label.
s = pd.Series([52, 13, 45, 39], index=[101, 205, 309, 412], name="amount")
print("First position:", s.iloc[0])
print("Label 309:", s.loc[309])
print("Label slice:")
print(s.loc[101:309])
print("Position slice:")
print(s.iloc[0:2])
Expected output
First position: 52
Label 309: 45
Label slice:
101    52
205    13
309    45
Name: amount, dtype: int64
Position slice:
101    52
205    13
Name: amount, dtype: int64
Update by Label or Position
Assign in one operation. Use loc for the label and iloc for the position. If a Series comes from a DataFrame, update the DataFrame directly when changing the original table is your goal; do not rely on changes to a selected Series propagating back.
s = pd.Series({"a": "Ravi", "b": "Raju", "c": "Alex"})
s.loc["b"] = "King"
print(s)
df = student_data()
df.loc[df["id"].eq(2), "mark"] = 90
print(df.loc[df["id"].eq(2)])
Expected output
a    Ravi
b    King
c    Alex
dtype: str
   id      name  mark
1   2  Max Ruin    90
Choose a Dtype and Handle Missing Integers
A Series has one dtype. Use nullable Int64 when integers may be missing; capitalisation matters. Use string when IDs should be text. An object Series can hold mixed Python objects, but that can make numeric analysis harder. Prefer consistent types with a clear purpose.
s = pd.Series([1, None, 3], dtype="Int64", name="id")
print(s)
text_ids = student_data()["id"].astype("string")
print(text_ids.head(3))
assert str(s.dtype) == "Int64"
Expected output
0       1
1    <NA>
2       3
Name: id, dtype: Int64
0    1
1    2
2    3
Name: id, dtype: string
Apply a Calculation to Every Value
Arithmetic such as s + 5 is vectorized and clear for simple numeric operations. apply accepts a callable when a custom transformation is needed. Independent examples below start from numeric_data() so a previous update does not alter later outputs.
def numeric_data():
    return pd.Series([52, 13, 45, 39], index=["x", "b", "y", "p"], name="amount")

s = numeric_data()
print(s + 5)
assert (s + 5).equals(s.apply(lambda value: value + 5))
print("Index labels:", s.index.tolist())
print("Value at label y:", s.loc["y"])
Expected output
x    57
b    18
y    50
p    44
Name: amount, dtype: int64
Index labels: ['x', 'b', 'y', 'p']
Value at label y: 45
Calculate Sum and Descriptive Statistics
A Series supports sum, min, max, mean, median, mode and standard deviation. mode can return several values when frequencies tie. The default standard deviation is a sample statistic with ddof=1. See sum() and describe() for interpretation.
s = numeric_data()
print("Sum:", s.sum())
print("Minimum:", s.min())
print("Maximum:", s.max())
print("Mean:", s.mean())
print("Median:", s.median())
print("Modes:", s.mode().tolist())
print("Sample std:", round(s.std(), 2))
assert s.sum() == 149
Expected output
Sum: 149
Minimum: 13
Maximum: 52
Mean: 37.25
Median: 42.0
Modes: [13, 39, 45, 52]
Sample std: 17.02
Sort Values or Sort Index Labels
sort_values orders the values; sort_index orders labels. Neither changes the other by itself. Keep labels when they identify records. Use ignore_index=True only when replacing the labels is intentional.
s = numeric_data()
print("Ascending values:")
print(s.sort_values())
print("Descending values:")
print(s.sort_values(ascending=False))
print("Sorted labels:")
print(s.sort_index())
Expected output
Ascending values:
b    13
p    39
y    45
x    52
Name: amount, dtype: int64
Descending values:
x    52
y    45
p    39
b    13
Name: amount, dtype: int64
Sorted labels:
b    13
p    39
x    52
y    45
Name: amount, dtype: int64
Remove Values with drop and pop
drop returns a Series without specified labels unless inplace=True is used. pop removes a label and returns its value. Both operate by labels, not positions. Start from fresh data when comparing the alternatives.
s = numeric_data()
print("Without b:")
print(s.drop(labels=["b"]))
print("Original still has b:", "b" in s.index)
s.drop(labels=["b"], inplace=True)
removed = s.pop("x")
print("Popped value:", removed)
print(s)
Expected output
Without b:
x    52
y    45
p    39
Name: amount, dtype: int64
Original still has b: True
Popped value: 52
y    45
p    39
Name: amount, dtype: int64
Add a Label and Rename the Series
Assigning to a new label appends a value. Assigning to an existing label updates it. rename changes the Series name when supplied a string; it can also remap labels when supplied a mapping. Choose the operation that matches your intent.
s = numeric_data()
s.loc["z"] = 50
s = s.rename("recorded_amount")
print(s)
assert s.name == "recorded_amount"
assert s.loc["z"] == 50
Expected output
x    52
b    13
y    45
p    39
z    50
Name: recorded_amount, dtype: int64
Filter Labels or Search Values
filter(items=...) selects labels; isin checks values. A Boolean mask selects matching entries. The expression value in s checks index labels, not membership among values. Use isin(...).any() when asking whether a value occurs.
s = numeric_data()
print("Labels x and p:")
print(s.filter(items=["x", "p"]))
mask = s.isin([50, 13])
print("Value-match mask:")
print(mask)
print("Matching entries:")
print(s[mask])
print("Matching labels:", s[mask].index.tolist())
print("Contains value 13:", s.isin([13]).any())
Expected output
Labels x and p:
x    52
p    39
Name: amount, dtype: int64
Value-match mask:
x    False
b     True
y    False
p    False
Name: amount, dtype: bool
Matching entries:
b    13
Name: amount, dtype: int64
Matching labels: ['b']
Contains value 13: True
Convert Values to a List or NumPy Array
tolist returns Python values; to_numpy returns a NumPy array. The labels are separate and can be converted through s.index. Extension dtypes may require an object array or an explicit missing-value representation. See the NumPy/Pandas interoperability guide.
s = numeric_data()
print("Values as list:", s.tolist())
print("Values as array:", s.to_numpy())
print("Labels as array:", s.index.to_numpy())
print("Array type:", type(s.to_numpy()).__name__)
Expected output
Values as list: [52, 13, 45, 39]
Values as array: [52 13 45 39]
Labels as array: ['x' 'b' 'y' 'p']
Array type: ndarray
Arithmetic Aligns Labels, Not Positions
This is a crucial difference from plain lists and arrays. Adding Series aligns matching labels even when their order differs. A missing label produces a missing result by default. Use fill_value only when the replacement is justified; zero is appropriate here only under the stated practice assumption of no recorded amount for the absent label.
left = pd.Series({"a": 300, "c": 400})
right = pd.Series({"c": 200, "a": 500, "d": 600})
print("Aligned addition:")
print(left + right)
print("Treat absent recorded amounts as zero:")
print(left.add(right, fill_value=0))
assert (left + right).loc["a"] == 800
Expected output
Aligned addition:
a    800.0
c    600.0
d      NaN
dtype: float64
Treat absent recorded amounts as zero:
a    800.0
c    600.0
d    600.0
dtype: float64
Combine Two Series by a Rule
combine applies a function to aligned values. np.maximum explicitly propagates missing values. With fill_value=0, missing labels are treated as zero before comparing; this may be inappropriate when real values can be negative. Choose the rule and missing-label policy deliberately.
left = pd.Series({"a": 300, "c": 400})
right = pd.Series({"a": 500, "c": 200, "d": 600})
print("Maximum with missing labels left unknown:")
print(left.combine(right, np.maximum))
print("Maximum with absent labels treated as zero:")
print(left.combine(right, max, fill_value=0))
Expected output
Maximum with missing labels left unknown:
a    500.0
c    400.0
d      NaN
dtype: float64
Maximum with absent labels treated as zero:
a    500
c    400
d    600
dtype: int64
Missing Values and a Known Subtotal
isna identifies missing values; sum(min_count=1) avoids turning an all-missing numeric Series into zero. A subtotal of observed values is not necessarily a complete total. Follow the fillna tutorial when choosing justified replacements.
s = pd.Series([40, None, 60], index=[1001, 1002, 1003], dtype="Float64", name="revenue")
print(s)
print("Known subtotal:", s.sum(min_count=1))
print("Rows needing review:", s.isna().sum())
print("Complete total:", s.sum(skipna=False))
assert s.sum(min_count=1) == 100
Expected output
1001    40.0
1002    <NA>
1003    60.0
Name: revenue, dtype: Float64
Known subtotal: 100.0
Rows needing review: 1
Complete total: <NA>
Practical Workflow: Prices Aligned by Product Code
Two departments provide prices in different product orders. Align by product code to calculate the price change; do not subtract raw arrays by position. The new product lacks a previous price, so its change remains missing. This synthetic example demonstrates a common reporting problem.
old_prices = pd.Series({"PEN": 20, "BOOK": 50, "FILE": 30}, name="old_price")
new_prices = pd.Series({"FILE": 35, "PEN": 22, "BOOK": 50, "CLIP": 5}, name="new_price")
change = (new_prices - old_prices).rename("price_change")
report = pd.concat([old_prices, new_prices, change], axis=1)
print(report)
assert change.loc["PEN"] == 2
assert change.loc["FILE"] == 5
assert pd.isna(change.loc["CLIP"])
Expected output
      old_price  new_price  price_change
PEN        20.0         22           2.0
BOOK       50.0         50           0.0
FILE       30.0         35           5.0
CLIP        NaN          5           NaN
Exercise: Find Values at Least 40
Use numeric_data(), keep values at least 40, sort descending and return the matching labels as a list. Predict the selected values and their sum before running the solution. Expected labels: x and y; known total 97.
Exercise Solution
Build a Boolean condition from the Series, select matching values, then sort them. Labels stay attached to their values throughout.
s = numeric_data()
selected = s[s.ge(40)].sort_values(ascending=False)
print(selected)
print("Labels:", selected.index.tolist())
print("Total:", selected.sum())
assert selected.index.tolist() == ["x", "y"]
assert selected.sum() == 97
Expected output
x    52
y    45
Name: amount, dtype: int64
Labels: ['x', 'y']
Total: 97
Review Questions
Can you explain the difference between a label and a position? Why does arithmetic align by labels? When is a missing total different from zero? Does sorting values replace the index? What does in check on a Series? Try answering before returning to the relevant examples.
- How do you create a pandas Series from a list?
- How can you access the index of a Series?
- How do you calculate the sum of values in a Series?
- What method can be used to check if a value exists in a Series?
- How can you change the name of a Series?
- How do you extract the first three elements from a Series?
- What method can be used to sort a Series in descending order?
- How do you apply a mathematical function to each element of a Series?
- How can you find the maximum value in a Series?
- How do you add a new element to a Series?
- Is a Pandas Series one-dimensional?
- Can a Pandas Series contain data of different types?
- Can you perform mathematical operations on a Pandas Series?
- Can you access elements of a Pandas Series by index?
- Can you change the index labels of a Pandas Series?
- Can you add or remove elements from a Pandas Series?
- Can you sort a Pandas Series?
- Can you perform element-wise comparisons on a Pandas Series?
- Can you apply a function to each element of a Pandas Series?
- Can you merge two Pandas Series into a single Series?
- Can you convert a Pandas Series to a NumPy array?
- Can you convert a Pandas Series to a Python list?
- Can you calculate the mean of a Pandas Series?
- Can you calculate the maximum value of a Pandas Series?
- Can you calculate the minimum value of a Pandas Series?
- Can you calculate the sum of all elements in a Pandas Series?
- Can you calculate the standard deviation of a Pandas Series?
- Can you replace specific values in a Pandas Series?
- Can you check if a value exists in a Pandas Series?
- Can you slice a Pandas Series to extract a subset of elements?
Practice in Google Colab
Open in Google Colab View on GitHub
Run each cell, change index labels and predict the aligned calculations. All synthetic data is embedded. For a larger dataset, visit the student sample-data page.
Continue with Pandas tutorials, DataFrames, dictionary conversion and text matching with contains(). Reference: Pandas Series documentation.

Subhendu Mohapatra
Author & Instructor at plus2net
I write and maintain practical tutorials on Python, PHP, SQL, JavaScript, HTML, jQuery, and web development at plus2net. The tutorials focus on clear explanations, working examples, and code that readers can test and adapt while learning.


Subscribe to our YouTube Channel here

 Python Video Tutorials