style object of DataFrame
df.style.format({'name':lambda x:x.lower()})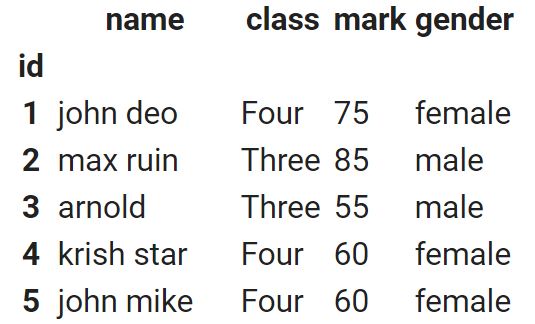
df.style.highlight_max(color='lightgreen')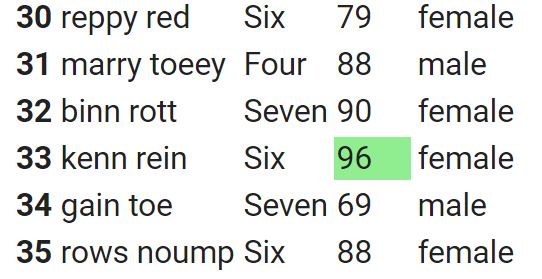
df.style.highlight_min(color='red')\
.highlight_max(color='lightgreen')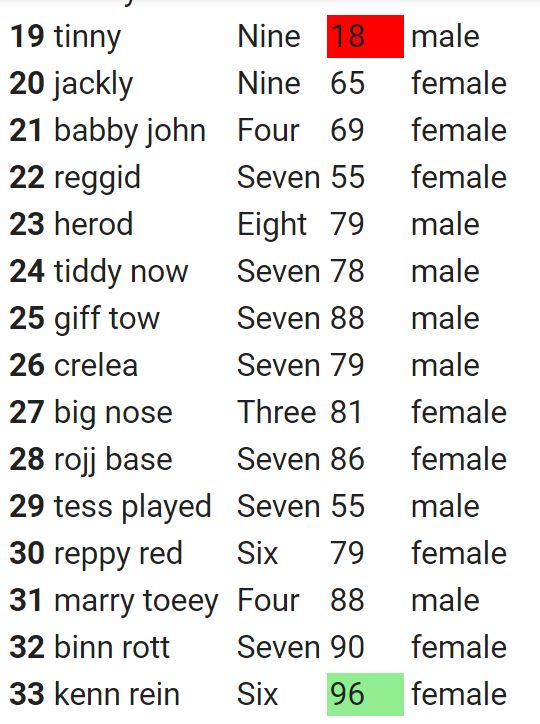
df.style.format({'name':lambda x:x.lower()})\
.background_gradient(cmap='Blues')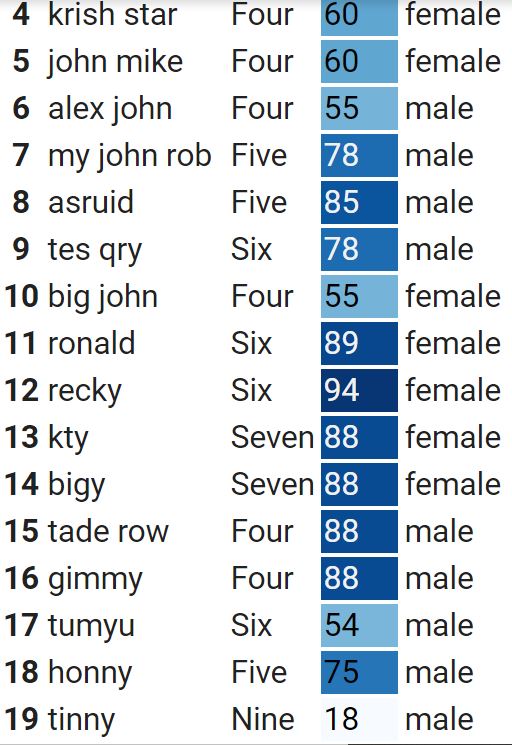
Highlighting the row based on condition
If the mark column is more than or equal to 60 then highlight the row with background colour. ( Note the *4 for number of columns )def highlight(s):
if s.mark >= 60: # change this condition
return ['background-color: yellow']*4
else:
return ['background-color: white']*4
df.style.apply(highlight, axis=1)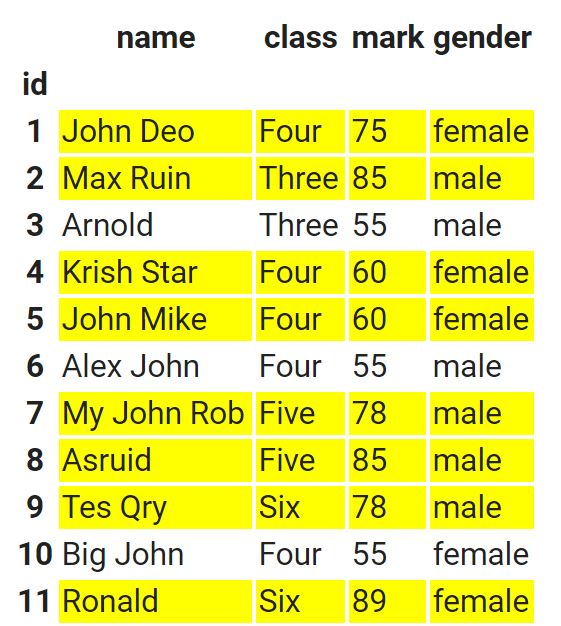
Creating HTML table from DataFrame
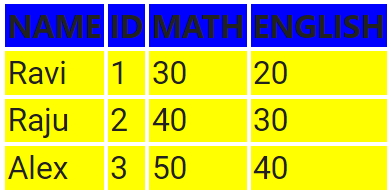
We will use set_table_styles() to add style property to our DataFrame and then we can display or create one html file ( my_html.html). Note that to display output we have to use our local setting. This code is tested in Google Colab.
import pandas as pd
import numpy as np
from IPython.core.display import display, HTML
my_dict={
	'NAME':['Ravi','Raju','Alex'],
	'ID':[1,2,3],'MATH':[30,40,50],
	'ENGLISH':[20,30,40]
	}
df= pd.DataFrame(data=my_dict)
my_styles = [
    {
       'selector': 'th',
       'props': [('background-color', 'blue'),
                 ('font-size',16),('style','bold'),
                 ('font-family','Segoe UI')]
   },{
       'selector':'td',
      'props':[('background-color', 'yellow'),
               ('font-size',12)]
   }
]
dfs = df.style.set_table_styles(my_styles)

html = dfs.hide_index().render() # get html
#create one html file#
with open("my_html.html","w") as fp:
   fp.write(html)

html = dfs.hide_index().render()
#*to display in a jupyter notebook*
display(HTML(html))contains() to display and delete row based on Conditions

Subhendu Mohapatra
Author
🎥 Join me live on YouTubePassionate about coding and teaching, I publish practical tutorials on PHP, Python, JavaScript, SQL, and web development. My goal is to make learning simple, engaging, and project‑oriented with real examples and source code.
Subscribe to our YouTube Channel here
This article is written by plus2net.com team.
https://www.plus2net.com

 Python Video Tutorials