PDF creation using Colab platform
Creating PDF in Colab Platform using reportlab
We will leverage the Google Colab platform, equipped with preinstalled Python modules, for seamless collaboration and code execution.
Checking Reportlab library
import imp
try:
    imp.find_module('reportlab') # check for library
    found = True
except ImportError:
    found = False
print(found)pip install reportlabGenerating our first PDF document
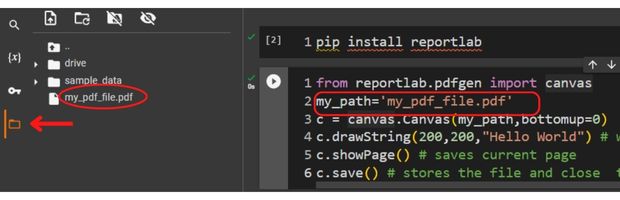
from reportlab.pdfgen import canvas
my_path='my_pdf_file.pdf'
c = canvas.Canvas(my_path,bottomup=0)
c.drawString(200,200,"Hello World") # write text in page
c.showPage() # saves current page
c.save() # stores the file and close  the canvas
Adding image
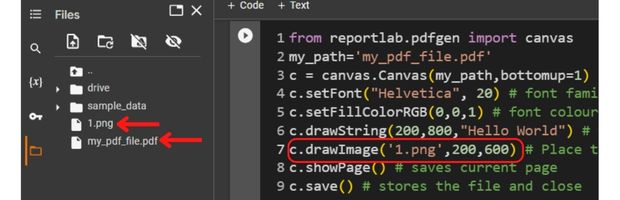
To begin working with an image on our Colab platform, we first need to upload it. This can be easily achieved by utilizing the upload icon located at the top side of the left panel. By doing this, the image will be downloaded directly from its URL and conveniently placed in your Colab workspace, specifically within the left panel. This streamlined process ensures that we can access and manipulate our images efficiently in Colab, setting the stage for further image processing or analysis tasks.
!wget https://www.plus2net.com/python/download/1.pngc.drawImage('1.png',200,600) # Place the image Create the PDF by adding a string and then by inserting the image.
from reportlab.pdfgen import canvas
my_path='my_pdf_file.pdf' # Name of the file
c = canvas.Canvas(my_path,bottomup=1) # create Canvas
c.setFont("Helvetica", 20) # font family and size
c.setFillColorRGB(0,0,1) # font colour as RGB
c.drawString(200,800,"Hello World") # write text in page
c.drawImage('1.png',200,600) # Place the image
c.showPage() # saves current page
c.save() # stores the file and close  the canvas
Generate PDFs with dynamic content: data taken from a database
Creating PDF in Colab Platform using SQLite Database table data with image #colab #pdf #sqlite
We're utilizing a SQLite database table that features a BLOB (Binary Large Object) column specifically designed for storing images. This approach allows us to dynamically retrieve these images directly from the table when creating our PDF file. By leveraging this method, we ensure that the content of our PDF remains dynamic and versatile, adapting seamlessly to the images stored in the database, thereby enhancing the functionality and efficiency of our document creation process.
# Download the database with a BLOB column storing the image.
!wget https://www.plus2net.com/python/download/student_blob.db
import sqlite3 # Connection library
my_conn = sqlite3.connect('student_blob.db') # connect to Databasequery="PRAGMA table_info([student_profile])" # SQL to get table structure
my_data=list(my_conn.execute(query)) # rows of data as list
print(my_data) # structure of the table query="SELECT * FROM student_profile LIMIT 0,5" # sql to display rows
my_data=list(my_conn.execute(query)) # rows of data as list
print(my_data) # includes the BLOB column dataHere the id column is an integer value so we will use str() to convert it to string while displaying.
import io
from PIL import Image
from reportlab.lib.utils import ImageReader
from reportlab.lib.units import inch

my_path='my_pdf.pdf' # file name
r_set=my_conn.execute('SELECT * from student_profile WHERE id=2');
for row in r_set:
  image = Image.open(io.BytesIO(row[2]))
io_img = ImageReader(image) # read image
c = canvas.Canvas(my_path,bottomup=1) # create Canvas
c.setFont('Times-Bold',16)
c.drawString(2*inch,6*inch,str(row[0])) # write namepage
c.drawString(3*inch,6*inch,row[1]) # write namepage
c.drawImage(io_img,4*inch,6*inch) # Add image
c.showPage() # saves current page
c.save() # save and close
Displaying multiple rows of data
import io
from PIL import Image
from reportlab.lib.utils import ImageReader
from reportlab.lib.units import inch

my_path='my_pdf.pdf'
c = canvas.Canvas(my_path,bottomup=1)
c.setFont('Times-Bold',16)
r_set=my_conn.execute('SELECT * from student_profile ORDER BY id DESC');
h=5 # Y coordinate to increase
for row in r_set:
  c.drawString(1*inch,h*inch-0.5,str(row[0])) # Id column
  c.drawString(2*inch,h*inch-0.5,row[1]) # Name column
  image = Image.open(io.BytesIO(row[2])) # get image from blob column
  io_img = ImageReader(image) # read the image
  c.drawImage(io_img,4*inch,h*inch) # Draw the image
  h=h+1.5 # increase the Y coordinate
c.showPage() # saves current page
c.save() # save and close
Download the above full source code from Github or run the code in your Google colab platform on how to generate pdf files using dynamic data from SQLite database
https://github.com/plus2net/Python-basics/blob/main/pdf_1.ipynb
https://github.com/plus2net/Python-basics/blob/main/pdf_1.ipynb
To download file to your local system add this code at the end.
from google.colab import files
files.download('my_pdf_multiple.pdf')
PDF Mark sheet by using data from SQLite database Generate PDF Invoice using Sales data Table from different data sources to PDF file Table from Pandas DataFrame to PDF file PDF Circles & Shapes
Create Report in PDF using Charts, images, tables and Paragraphs
PDF Id-card ID card from user Inputs in Tkinter
Bar charts in PDF Line charts in PDF Pie Charts Paragraph
Python