PDF report using image, charts and Paragraphs
Creating PDF report by using charts, table, graphs with text paragraphs by combination of components
We are adding five different components to our report. We created the images , charts, graphs and paragraphs separately and imported them to our main.py file. ( download the Zip file below with all source codes/ files )
from chart_verticalbar_chart import d
from table_1_basic import t
from chart_linechart import line_chart
from paragraph1 import p1,p2,p3
from chart_2_circle import d_circlemy_path='G:\\My drive\\testing\\pypdf2\\my_pdf.pdf'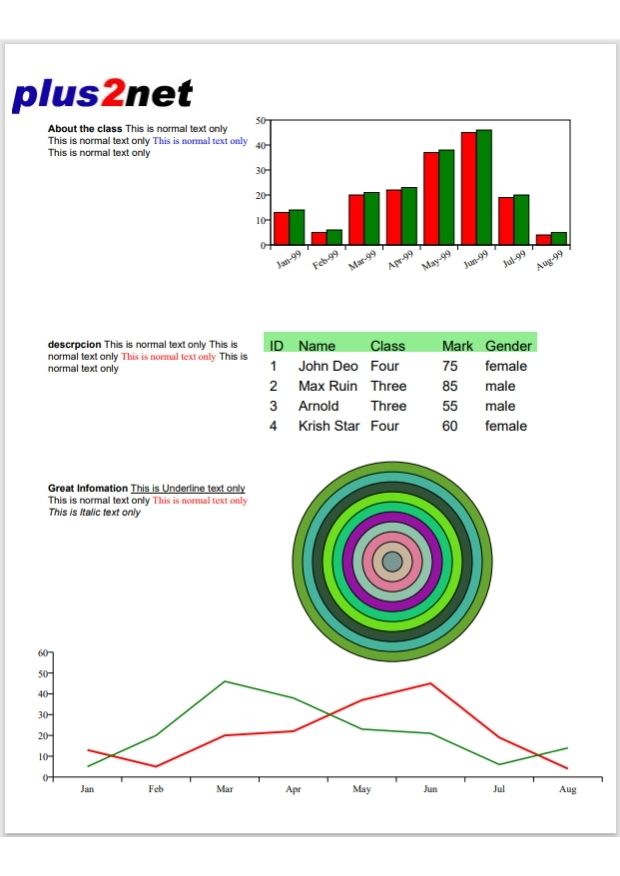
Adding Image
Change the path of image here.Adding image to PDF.
c.drawImage('D:\\top2.jpg',.1*inch,10*inch) # image at left side topAdding Vertical Bar chart
Bar charts in PDFfrom chart_verticalbar_chart import d
d.wrapOn(c,400,400)
d.drawOn(c, 3*inch,7.5*inch) # vertical bar chart Adding table
Table from different data sources to PDF filefrom table_1_basic import t
t.wrapOn(c, width, height)
t.drawOn(c,3.6*inch, 5.6*inch) # table at right sideAdding Paragraphs
Paragraphfrom paragraph1 import p1,p2,p3
p1.wrapOn(c, 200, 200)
p1.drawOn(c, .6*inch,9.4*inch) # top paragraph of text
p2.wrapOn(c, 200, 200)
p2.drawOn(c, .6*inch,6.4*inch) # middle paragraph of text
p3.wrapOn(c, 200, 200)
p3.drawOn(c, .6*inch,4.4*inch) # last paragraph of text Adding shapes ( Circles )
PDF Circles & Shapesfrom chart_2_circle import d_circle
d_circle.wrapOn(c, 100, 100)
d_circle.drawOn(c, 4*inch,2.4*inch) # circles drawn at right Adding Line chart
Line charts in PDFfrom chart_linechart import line_chart
line_chart.wrapOn(c, 810, 200)
line_chart.drawOn(c, .6*inch,.1*inch) # line chart at bottommain.py
from reportlab.pdfgen import canvas
from reportlab.lib.pagesizes import letter
from reportlab.lib.units import inch
from chart_verticalbar_chart import d
from table_1_basic import t
from chart_linechart import line_chart
from paragraph1 import p1,p2,p3
from chart_2_circle import d_circle
my_path='G:\\My drive\\testing\\pypdf2\\my_pdf.pdf'
c = canvas.Canvas(my_path, pagesize=letter)
width, height = letter
c.drawImage('D:\\top2.jpg',.1*inch,10*inch)  # image at left side top
d.wrapOn(c,400,400)
d.drawOn(c, 3*inch,7.5*inch)   # vertical bar chart
t.wrapOn(c, width, height)
t.drawOn(c,3.6*inch, 5.6*inch) # table at right side
p1.wrapOn(c, 200, 200)
p1.drawOn(c, .6*inch,9.4*inch) # top paragraph of text
p2.wrapOn(c, 200, 200)
p2.drawOn(c, .6*inch,6.4*inch) # middle paragraph of text
p3.wrapOn(c, 200, 200)
p3.drawOn(c, .6*inch,4.4*inch) # last paragraph of text
d_circle.wrapOn(c, 100, 100)
d_circle.drawOn(c, 4*inch,2.4*inch) # circles drawn at right
line_chart.wrapOn(c, 810, 200)
line_chart.drawOn(c, .6*inch,.1*inch) # line chart at bottom
c.save()
Download .zip file with all source codes/files
Python PDF Line charts in PDF Pie Charts
PDF Mark sheet by using data from SQLite database

Subhendu Mohapatra
Author
🎥 Join me live on YouTubePassionate about coding and teaching, I publish practical tutorials on PHP, Python, JavaScript, SQL, and web development. My goal is to make learning simple, engaging, and project‑oriented with real examples and source code.
Subscribe to our YouTube Channel here
This article is written by plus2net.com team.
https://www.plus2net.com

 Python Video Tutorials