Generate PDF Invoices in Python with ReportLab — Complete Guide
Interactive Google Colab Practice Notebook
Practice generating PDF sales invoices using ReportLab with multi-source data (CSV, Excel, JSON, XML, SQL dump, SQLite, and MySQL) and custom layout templates directly inside Google Colab.
View on GitHub
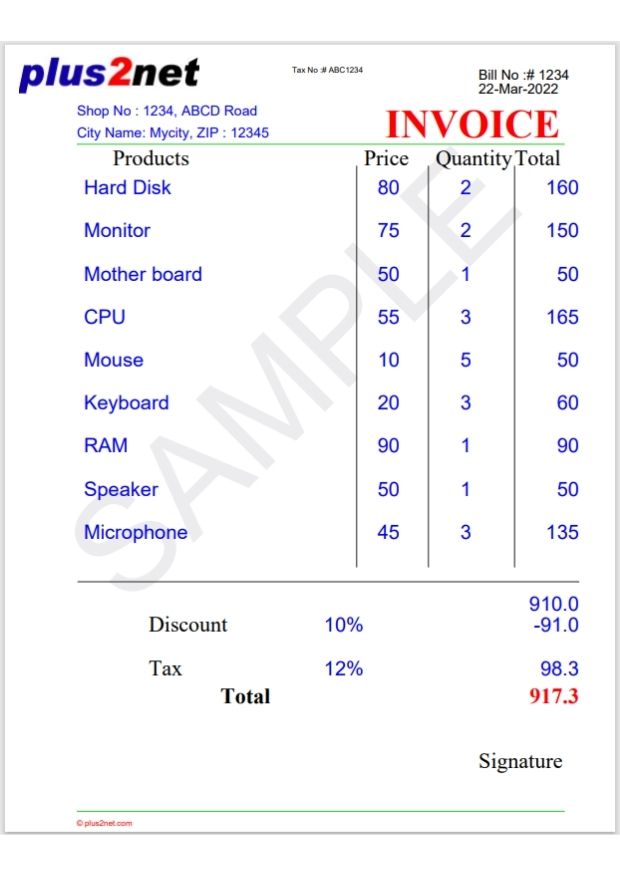
- Keep the watermark at the starting so all other lines and text will appear over it.
- To draw a vertical line, keep the x1 and x2 values identical.
- To draw a horizontal line, keep the y1 and y2 values identical.
- Default font styles are available via the
getAvailableFonts()canvas method. - For monetary and currency figures, align strings to the right using
drawRightString(). - Dynamic invoice dates can be formatted using Python's standard
datetime.datemodule.
Three files are used in this implementation with the ReportLab library to construct the PDF document.
The invoice_data.py file supplies sales records. While sample data is defined as dictionary variables, this file can be linked to external relational databases or flat files.
Data Sources 🔝
You can also download sample student and sales datasets in multiple formats directly from the plus2net pandas student tutorial page:
!wget https://www.plus2net.com/python/download/student.csv
!wget https://www.plus2net.com/python/download/student.xlsx
!wget https://www.plus2net.com/python/download/student.json
!wget https://www.plus2net.com/python/download/student.xml
!wget https://www.plus2net.com/python/download/student.sql
invoice_data.py 🔝
This file stores sample product catalog records and line-item sales orders in Python dictionaries, alongside global variables for tax and discount rates.
my_prod is a dictionary mapping product_id to a list containing [product_name, unit_price]:
my_prod = {
    1: ['Hard Disk', 80], 2: ['RAM', 90], 3: ['Monitor', 75],
    4: ['CPU', 55], 5: ['Keyboard', 20], 6: ['Mouse', 10],
    7: ['Mother board', 50], 8: ['Power Supply', 20],
    9: ['Speaker', 50], 10: ['Microphone', 45]
}
my_sale is a dictionary mapping product_id to quantity_sold:
my_sale = {1: 2, 3: 2, 7: 1, 4: 3, 6: 5, 5: 3, 2: 1, 9: 1, 10: 3}
discount_rate = 10 # 10% discount
tax_rate = 12 # 12% tax rate
Multi-Source Ingestion Pipelines for Invoice Data
The product catalog and billing details (my_prod and my_sale) can be dynamically loaded from an SQLite/MySQL database, an Excel sheet, a CSV file, a JSON file, or an XML file:
from sqlalchemy import create_engine

# Connect to SQLite or MySQL
engine = create_engine('sqlite:///my_db.db')
with engine.connect() as conn:
    prods = conn.execute("SELECT id, name, price FROM products").fetchall()
    my_prod = {p[0]: [p[1], float(p[2])] for p in prods}

    sales = conn.execute("SELECT product_id, quantity FROM sales_items WHERE invoice_id = 1234").fetchall()
my_sale = {s[0]: s[1] for s in sales}import pandas as pd
# Read catalog from CSV or Excel
df_prod = pd.read_csv('products.csv')
my_prod = {row['id']: [row['name'], float(row['price'])] for _, row in df_prod.iterrows()}
df_sale = pd.read_excel('sales.xlsx')
my_sale = {row['product_id']: int(row['quantity']) for _, row in df_sale.iterrows()}import json
import xml.etree.ElementTree as ET
# Load JSON Invoice Data
with open('invoice.json', 'r') as f:
inv_data = json.load(f)
my_prod = {item['id']: [item['name'], item['price']] for item in inv_data['products']}
my_sale = {item['id']: item['qty'] for item in inv_data['items']}temp_invoice.py 🔝
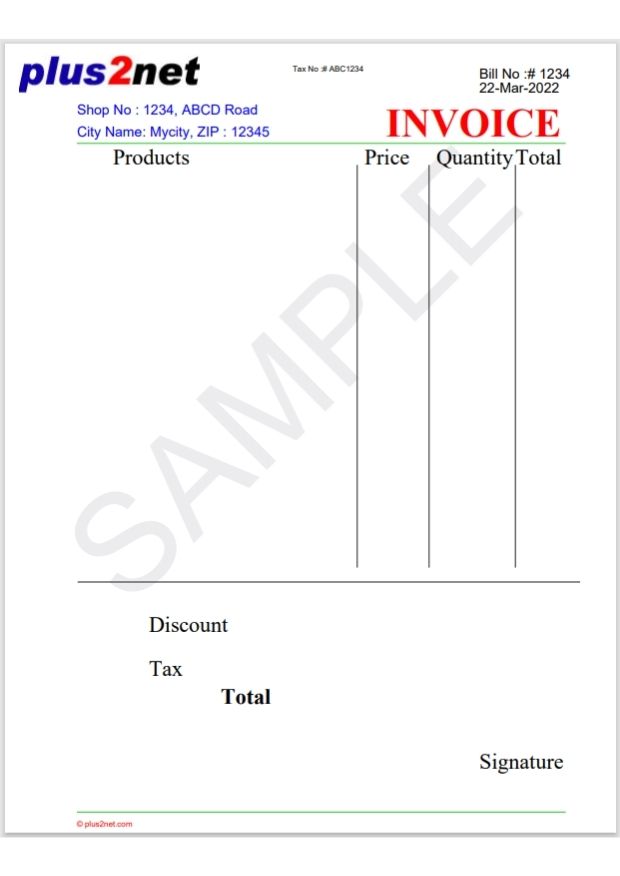
This template module encapsulates the static design layout inside my_temp(). It draws grid lines, structural column headers, header logos, address details, and watermarks onto the ReportLab canvas before line items are rendered.
invoice.py 🔝
This main execution module imports the template renderer (temp_invoice.py) and data structures (invoice_data.py) to build the complete invoice PDF.
from temp_invoice import my_temp # import the template
from invoice_data import *  # get invoice data
Using a for loop, sales records are iterated over to render item names, unit prices, quantities, and line totals. drawRightString() is utilized to format numerical currency columns cleanly:
for items in my_sale:
    c.drawString(0.1 * inch, line_y * inch, str(my_prod[items][0])) # Product Name
    c.drawRightString(4.5 * inch, line_y * inch, str(my_prod[items][1])) # Unit Price
    c.drawRightString(5.5 * inch, line_y * inch, str(my_sale[items])) # Quantity
    sub_total = my_prod[items][1] * my_sale[items]
    c.drawRightString(7 * inch, line_y * inch, str(sub_total)) # Sub Total
    total = round(total + sub_total, 1)
    line_y = line_y - row_gap
Source Code Files 🔝
invoice_data.py
# Data setting for invoice (Can be generated from Database, Excel, or CSV)
my_prod = {
    1: ['Hard Disk', 80], 2: ['RAM', 90], 3: ['Monitor', 75],
    4: ['CPU', 55], 5: ['Keyboard', 20], 6: ['Mouse', 10],
    7: ['Mother board', 50], 8: ['Power Supply', 20],
    9: ['Speaker', 50], 10: ['Microphone', 45]
}

# Sales mapping: product_id -> quantity_sold
my_sale = {1: 2, 3: 2, 7: 1, 4: 3, 6: 5, 5: 3, 2: 1, 9: 1, 10: 3}

discount_rate = 10 # 10% discount
tax_rate = 12      # 12% tax rate
temp_invoice.py
from reportlab.lib.units import inch
from datetime import date

def my_temp(c):
    c.translate(inch, inch)
    c.setFont("Helvetica", 14)
    c.setStrokeColorRGB(0.1, 0.8, 0.1)
    c.setFillColorRGB(0, 0, 1) # header text color

    # Business Header
    c.drawString(0, 9 * inch, "Shop No : 1234, ABCD Road")
    c.drawString(0, 8.7 * inch, "City Name: Mycity, ZIP : 12345")
    c.setFillColorRGB(0, 0, 0)
    c.line(0, 8.6 * inch, 6.8 * inch, 8.6 * inch)

    c.drawString(5.6 * inch, 9.5 * inch, 'Bill No :# 1234')
    dt = date.today().strftime('%d-%b-%Y')
    c.drawString(5.6 * inch, 9.3 * inch, dt)

    c.setFont("Helvetica", 8)
    c.drawString(3 * inch, 9.6 * inch, 'Tax No :# ABC1234')
    c.setFillColorRGB(1, 0, 0)
    c.setFont("Times-Bold", 40)
    c.drawString(4.3 * inch, 8.7 * inch, 'INVOICE')

    # Background Watermark
    c.rotate(45)
    c.setFillColorCMYK(0, 0, 0, 0.08)
    c.setFont("Helvetica", 140)
    c.drawString(2 * inch, 1 * inch, "SAMPLE")
    c.rotate(-45)

    # Table Headers
    c.setFillColorRGB(0, 0, 0)
    c.setFont("Times-Roman", 22)
    c.drawString(0.5 * inch, 8.3 * inch, 'Products')
    c.drawString(4 * inch, 8.3 * inch, 'Price')
    c.drawString(5 * inch, 8.3 * inch, 'Quantity')
    c.drawString(6.1 * inch, 8.3 * inch, 'Total')

    # Vertical Table Gridlines
    c.setStrokeColorCMYK(0, 0, 0, 1)
    c.line(3.9 * inch, 8.3 * inch, 3.9 * inch, 2.7 * inch)
    c.line(4.9 * inch, 8.3 * inch, 4.9 * inch, 2.7 * inch)
    c.line(6.1 * inch, 8.3 * inch, 6.1 * inch, 2.7 * inch)
    c.line(0.01 * inch, 2.5 * inch, 7 * inch, 2.5 * inch)

    # Footer Totals Labels
    c.drawString(1 * inch, 1.8 * inch, 'Discount')
    c.drawString(1 * inch, 1.2 * inch, 'Tax')
    c.setFont("Times-Bold", 22)
    c.drawString(2 * inch, 0.8 * inch, 'Total')
    c.setFont("Times-Roman", 22)
    c.drawString(5.6 * inch, -0.1 * inch, 'Signature')
    c.setStrokeColorRGB(0.1, 0.8, 0.1)
    c.line(0, -0.7 * inch, 6.8 * inch, -0.7 * inch)

    c.setFont("Helvetica", 8)
    c.setFillColorRGB(1, 0, 0)
    c.drawString(0, -0.9 * inch, "\u00A9 plus2net.com")

    return c
invoice.py
from pathlib import Path
from reportlab.pdfgen import canvas
from reportlab.lib.units import inch
from reportlab.lib.pagesizes import letter
from temp_invoice import my_temp
from invoice_data import *

output_dir = Path('output')
output_dir.mkdir(exist_ok=True)
my_path = output_dir / 'sales_invoice.pdf'

c = canvas.Canvas(str(my_path), pagesize=letter)
c = my_temp(c)

c.setFillColorRGB(0, 0, 1)
c.setFont("Helvetica", 20)
row_gap = 0.6
line_y = 7.9
total = 0

for items in my_sale:
    c.drawString(0.1 * inch, line_y * inch, str(my_prod[items][0]))
    c.drawRightString(4.5 * inch, line_y * inch, str(my_prod[items][1]))
    c.drawRightString(5.5 * inch, line_y * inch, str(my_sale[items]))
    sub_total = my_prod[items][1] * my_sale[items]
    c.drawRightString(7 * inch, line_y * inch, str(sub_total))
    total = round(total + sub_total, 1)
    line_y = line_y - row_gap

c.drawRightString(7 * inch, 2.1 * inch, str(float(total)))
discount = round((discount_rate / 100) * total, 1)
c.drawRightString(4 * inch, 1.8 * inch, str(discount_rate) + '%')
c.drawRightString(7 * inch, 1.8 * inch, '-' + str(discount))

tax = round((tax_rate / 100) * (total - discount), 1)
c.drawRightString(4 * inch, 1.2 * inch, str(tax_rate) + '%')
c.drawRightString(7 * inch, 1.2 * inch, str(tax))

total_final = total - discount + tax
c.setFont("Times-Bold", 22)
c.setFillColorRGB(1, 0, 0)
c.drawRightString(7 * inch, 0.8 * inch, str(total_final))

c.showPage()
c.save()
print(f"Invoice PDF generated successfully: {my_path}")
Practical Uses of Dynamic Invoice PDF Generation
Automating sales billing and invoice creation with ReportLab templates offers clear production advantages:
- Automated E-Commerce Billing: Convert checkout order payloads dynamically into downloadable or emailable customer PDF invoices.
- Database-Driven Financial Operations: Fetch billing items directly from relational databases (SQLite, MySQL) or business spreadsheets (Excel, CSV).
- Compliant & Custom Layouts: Add company tax identifiers, itemized line calculations, percentage-based discounts, tax breakdowns, and security watermarks.
Common Errors & Troubleshooting
- Column Text Overlap & Alignment: Left-aligning numerical price values with
drawString()can cause columns to misalign. Always usedrawRightString()for price, tax, and total columns. - Vertical Row Overflow: If an order contains more line items than fit on a single canvas page, decrementing
line_ycan draw text past the bottom margin. Monitorline_yand invokec.showPage()andmy_temp(c)when line space runs out. - Floating-Point Currency Precision: Standard Python floating-point math can introduce small precision artifacts (e.g. `79.9999999`). Wrap currency calculations with
round(val, 2)or standard formatting functions before drawing.
Frequently Asked Questions (FAQ)
Q: How can I change the tax rate dynamically per customer region?
A: Pass the `tax_rate` variable as an input argument when executing your generation script or query it from your regional customer database table.
Q: How do I handle multi-page invoices for large sales orders?
A: In your item iteration loop, check if line_y < 3.0. If true, invoke c.showPage(), re-apply c = my_temp(c), and reset line_y = 7.9 before continuing item rendering.
Further Reading & Related Tutorials
- Python ReportLab PDF Generation Hub Page
- Pandas Student Dataset Resource Downloads
- PDF Mark Sheet by Using Data from SQLite Database
- Table from Different Data Sources to PDF File
- Table from Pandas DataFrame to PDF File
- Generate ID Card in PDF using Template & SQLite BLOB Data
- User Inputs from Tkinter to Create ID Card
Python PDF PDF Mark sheet by using data from SQLite database Table from different data sources to PDF file Table from Pandas DataFrame to PDF file

Subhendu Mohapatra
Author & Instructor at plus2net
I write and maintain practical tutorials on Python, PHP, SQL, JavaScript, HTML, jQuery, and web development at plus2net. The tutorials focus on clear explanations, working examples, and code that readers can test and adapt while learning.


Subscribe to our YouTube Channel here

 Python Video Tutorials