Python tkinter frame
Tkinter frame to hold widgets and images with background colour border and managing layout
Managing widgets in a group and providing separators by using frame.( Think Frame as a container )
Size of the frame
We can specify width and height of the frame. If you are using pack layout then set theexapand=True to cover all the available space.
frame_top=Frame(my_w,width=390, height=390)
frame_top.pack(expand=True)
Adding border to frame
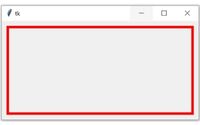 We will use the options
 highlightbackground='red' and highlightthicknes=5 to add red colour and thickness of 5 to the borders. For grid layout we can use rowconfigure , columnconfigure to manage full width
import tkinter  as tk
from tkinter import *
my_w = tk.Tk()
my_w.geometry("400x200")
frame_top=Frame(my_w,width=380, height=180,
highlightbackground='red',highlightthicknes=5)
frame_top.pack(expand=True)
my_w.mainloop()
Adding image to Frame
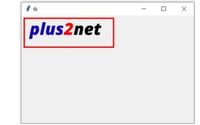 We will use Label to place the image. We can use Button also to place the image. Here to use jpg image we have to use PIL.
import tkinter  as tk
from tkinter import *
my_w = tk.Tk()
my_w.geometry("400x400")
frame_top=Frame(my_w,width=390, height=390,
highlightbackground='red',highlightthicknes=3)
frame_top.grid(row=0,column=0,padx=5,pady=5,ipadx=5,ipady=5)

my_img = tk.PhotoImage(file = "D:\\top2.png")
l2 = tk.Label(frame_top,  image=my_img )
l2.grid(row=0,column=0,padx=5,pady=5)

my_w.mainloop()
Background colour of Frame
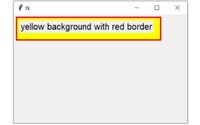 Use the option
 background='yellow' or use Hex code ( #FFFF00 ) to assign background colour to the frame. If you are using pack layout then keep the option
expand=True to cover all available areas.
import tkinter  as tk
from tkinter import *
my_w = tk.Tk()
my_w.geometry("400x400")
frame_top=Frame(my_w,width=390, height=390,background='yellow',
highlightbackground='red',highlightthicknes=3)
frame_top.grid(row=0,column=0,padx=5,pady=5,ipadx=5,ipady=5)

l2 = tk.Label(frame_top,text='yellow background with red border' )
l2.grid(row=0,column=0,padx=5,pady=5)

my_w.mainloop()
Understanding Multiple frame layout
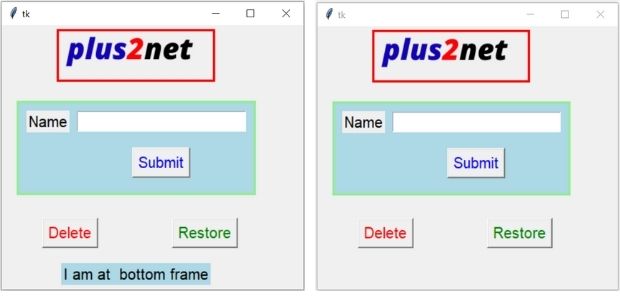
To remove the butom frame ( frame_bottom ) the command option for button is used.
command=lambda:frame_bottom.grid_forget(), here in place of grid_forget(), pack_forget() is to be used for pack layout manager.
import tkinter  as tk
from tkinter import *
my_w = tk.Tk()
my_w.geometry("400x350")
frame_top=Frame(my_w,width=390, height=150,
highlightbackground='red',highlightthicknes=3)
frame_top.grid(row=0,column=0,
    padx=5,pady=5,ipadx=5,ipady=5,columnspan=2)

my_img = tk.PhotoImage(file = "D:\\top2.png")
l2 = tk.Label(frame_top,  image=my_img )
l2.grid(row=0,column=0,padx=5,pady=5)

frame_body=Frame(my_w,width=380, height=150,background='lightblue',
highlightbackground='lightgreen',highlightthicknes=3)
frame_body.grid(row=1,column=0,
    padx=20,pady=20,ipadx=5,ipady=5,columnspan=2)
l3=tk.Label(frame_body,text='Name',font=16)
l3.grid(row=0,column=0,padx=10,pady=10)
t1=tk.Entry(frame_body,width=20,font=16)
t1.grid(row=0,column=1)
b1=tk.Button(frame_body,text='Submit',font=20,fg='blue')
b1.grid(row=1,column=1,padx=20,pady=10)

b2=tk.Button(my_w,text='Delete',font=20,
    fg='Red',command=lambda:frame_bottom.grid_forget() )
b2.grid(row=2,column=0,padx=10,pady=10)

b3=tk.Button(my_w,text='Restore',font=20,fg='Green',
    command=lambda:frame_bottom.grid(row=3,column=0,columnspan=2) )
b3.grid(row=2,column=1,pady=10)

frame_bottom=Frame(my_w,width=380, height=150)
frame_bottom.grid(row=3,column=0,columnspan=2)
l4=tk.Label(frame_bottom,text='I am at  bottom frame' ,
    bg='lightblue',font=18)
l4.grid(row=0,column=0,pady=10,sticky='w')
my_w.mainloop()Config options
background | Background colour to use, check the Output in above code for background |
bg | Same as background |
borderwidth | Width of the border of the Frame ( check examples) |
bd | Same as borderwidth |
class | Assign class , default is Frame |
colormap | specify which color map to use |
container | Default is 0 |
cursor | List of cursor shape is available here . The shape of mouse pointer to be displayed over the frame |
height | Default is 0, part of size ( width , height) |
highlightbackground | Default is system specific 9, border colour |
highlightcolor | Default is system specific, border colour when in focus |
highlightthicknes | Default is 0, border thickness when in focus |
padx | Horizontal padding, Default is 0 |
pady | Vertical padding, Default is 0 |
relief | FLAT ( default ), SUNKEN, RAISED, GROOVE,RIDGE . The border decoration |
takefocus | If true , tab can be used to move focus, Default is 0 |
visual | No Default |
width | Default is 0, part of size ( width , height) |
Example
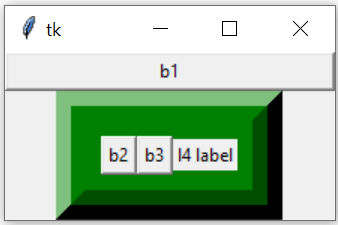
import tkinter as tk
from tkinter import *
my_w=tk.Tk()

my_bottom=Frame(my_w,bg='green',cursor='boat',bd=20,relief=RAISED,
                width=100,padx=10,pady=10,highlightcolor='yellow')
my_bottom.pack(side=BOTTOM)

b1=tk.Button(my_w,text='b1', width=30)
b1.pack(side=LEFT)

# Using Frame by_bottom
b2=tk.Button(my_bottom,text='b2')
b2.pack(side=LEFT)


b3=tk.Button(my_bottom,text='b3')
b3.pack(side=LEFT)
l4=tk.Label(my_bottom,text='l4 label')
l4.pack(side=LEFT)

my_w.mainloop()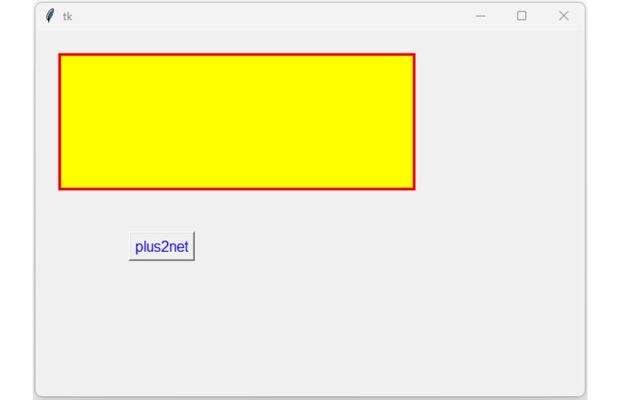
import tkinter as tk

my_w = tk.Tk()
my_w.geometry("600x400") # width x height of window
def my_open():
    frame_top.config(bg='lightgreen')

frame_top=tk.Frame(my_w,width=390, height=150,bg='yellow',
                   highlightbackground='red',highlightthicknes=3)
frame_top.grid(row=0,column=0,padx=25,pady=25,columnspan=2)

my_button = tk.Button(my_w,text="plus2net", fg="blue",
                      cursor="hand2",font=18,command=my_open)
my_button.grid(row=1, column=0,padx=20, pady=20)
my_w.mainloop()
separator
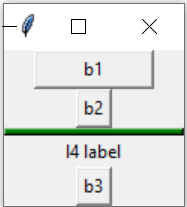
import tkinter as tk
from tkinter import *
my_w=tk.Tk()

b1=tk.Button(my_w,text='b1', width=10)
b1.pack(side=TOP)

# Using Frame by_bottom
b2=tk.Button(my_w,text='b2')
b2.pack(side=TOP)
my_line=Frame(my_w,bg='green',bd=20,height=5,width=20,
              relief=RAISED,highlightcolor='yellow')
my_line.pack(side=TOP,fill=X)

b3=tk.Button(my_w,text='b3')
b3.pack(side=BOTTOM)
l4=tk.Label(my_w,text='l4 label')
l4.pack(side=BOTTOM)

my_w.mainloop()
Nested Frames

-
Outer Frame (frame_side):
- This is the main frame inside the window (my_w) and acts as a container for the nested frames.
- Positioned using grid() with row=0 and column=0.
-
Nested Frame 1 (nested_frame1):
- Placed inside frame_side using grid() with row=1, column=0.
- Contains a Label and a Button.
-
Nested Frame 2 (nested_frame2):
- Also placed inside frame_side using grid() with row=1, column=1.
- Contains its own Label and Button.
-
Layout:
- Each frame and widget uses the grid layout manager, ensuring clear positioning and alignment.
-
Styling:
- Background colors (lightblue, lightgreen, lightyellow) visually distinguish the frames.
import tkinter as tk

# Main window
my_w = tk.Tk()
my_w.geometry("400x260")
my_w.title("Nested Frames Example")

# Outer Frame
frame_side = tk.Frame(my_w, width=450, height=250, bg="lightblue")
frame_side.grid(row=0, column=0, padx=30, pady=50)

# Adding a label to the outer frame
l1 = tk.Label(frame_side, text="Outer Frame",
	bg="lightblue", font=("Arial", 14))
l1.grid(row=0, column=0, padx=10, pady=5)

# Nested Frame 1 inside the outer frame
nested_frame1 = tk.Frame(frame_side, width=200, height=100,
	bg="lightgreen", relief="solid", borderwidth=1)
nested_frame1.grid(row=1, column=0, padx=10, pady=10)

# Add widgets to Nested Frame 1
nested_label1 = tk.Label(nested_frame1, text="Nested Frame 1",
	bg="lightgreen", font=("Arial", 12))
nested_label1.grid(row=0, column=0, padx=10, pady=5)

nested_button1 = tk.Button(nested_frame1, text="Button 1")
nested_button1.grid(row=1, column=0, padx=10, pady=5)

# Nested Frame 2 inside the outer frame
nested_frame2 = tk.Frame(frame_side, width=200, height=100,
	bg="lightyellow", relief="solid", borderwidth=1)
nested_frame2.grid(row=1, column=1, padx=10, pady=10)

# Add widgets to Nested Frame 2
nested_label2 = tk.Label(nested_frame2, text="Nested Frame 2",
	bg="lightyellow", font=("Arial", 12))
nested_label2.grid(row=0, column=0, padx=10, pady=5)

nested_button2 = tk.Button(nested_frame2, text="Button 2")
nested_button2.grid(row=1, column=0, padx=10, pady=5)

my_w.mainloop() # Main event loop
Example: Data Visualization Dashboard using Tkinter Frame

Creating a simple data visualization dashboard in Tkinter involves combining various widgets and a plotting library like Matplotlib to display charts and information. Here's an example of a dashboard that shows a pie chart, a bar chart, and some numerical stats:
- Main Application Window:
- The main window (root) is created with a title "Data Visualization Dashboard" and dimensions 800x600 pixels using the geometry() method.
- Title Frame:
- A Frame widget (title_frame) is used to display the title of the dashboard.
- The Label widget (title_label) is placed within this frame and styled with the Arial font and a light blue background.
- Stats Frame:
- The stats_frame holds statistical information, such as total sales, new users, and revenue.
- Each statistic is displayed as a Label with a white background and solid border.
- Charts Frame:
- The charts_frame is a container for the visualizations (Pie Chart and Bar Chart).
- Pie Chart:
- A Frame (pie_frame) is used to hold the pie chart visualization.
- The pie chart shows product distribution using plt.pie() and is embedded into the Tkinter frame using FigureCanvasTkAgg.
- It includes labels ("Product A", "Product B", "Product C") and percentages with distinct colors.
- Bar Chart:
- A Frame (bar_frame) is used to hold the bar chart visualization.
- The bar chart displays monthly sales using plt.bar() and is embedded into the Tkinter frame.
- Categories ("Jan", "Feb", "Mar", etc.) represent the months, and the values represent sales.
- Embedding Matplotlib Charts:
- The FigureCanvasTkAgg class from matplotlib.backends.backend_tkagg integrates Matplotlib charts into Tkinter.
- Each chart is rendered and packed into its respective frame (pie_frame and bar_frame).
- Running the Application:
- The mainloop() method is used to start the Tkinter event loop and keep the application open.
import tkinter as tk
from tkinter import ttk
from matplotlib.backends.backend_tkagg import FigureCanvasTkAgg
import matplotlib.pyplot as plt

# Create the main application window
root = tk.Tk()
root.title("Data Visualization Dashboard")
root.geometry("800x600")

# Frame for the title
title_frame = tk.Frame(root, bg="lightblue", height=50)
title_frame.pack(fill="x")
title_label = tk.Label(title_frame, text="Data Visualization Dashboard",
	font=("Arial", 20), bg="lightblue")
title_label.pack(pady=10)

# Frame for the stats
stats_frame = tk.Frame(root, bg="white", height=100)
stats_frame.pack(fill="x", padx=10, pady=5)

# Add some stats labels
stats = [("Total Sales", 1234), ("New Users", 567), ("Revenue ($)", 8901)]
for i, (label, value) in enumerate(stats):
    stat_label = tk.Label(stats_frame, text=f'{label}\n{value}',
		font=("Arial", 14), bg="white", relief="solid", width=20)
    stat_label.grid(row=0, column=i, padx=20, pady=10)

# Frame for the charts
charts_frame = tk.Frame(root)
charts_frame.pack(fill="both", expand=True, padx=10, pady=5)

# Pie Chart
pie_frame = tk.Frame(charts_frame, bg="white", relief="solid", width=400, height=300)
pie_frame.grid(row=0, column=0, padx=10, pady=10)

pie_data = [30, 20, 50]
pie_labels = ["Product A", "Product B", "Product C"]
fig_pie, ax_pie = plt.subplots(figsize=(4, 3))
ax_pie.pie(pie_data, labels=pie_labels, autopct='%1.1f%%',
	colors=["lightcoral", "gold", "skyblue"])
ax_pie.set_title("Product Distribution")
canvas_pie = FigureCanvasTkAgg(fig_pie, pie_frame)
canvas_pie.get_tk_widget().pack()

# Bar Chart
bar_frame = tk.Frame(charts_frame, bg="white", relief="solid", width=400, height=300)
bar_frame.grid(row=0, column=1, padx=10, pady=10)

bar_categories = ["Jan", "Feb", "Mar", "Apr", "May"]
bar_values = [200, 150, 300, 250, 400]
fig_bar, ax_bar = plt.subplots(figsize=(4, 3))
ax_bar.bar(bar_categories, bar_values, color="skyblue")
ax_bar.set_title("Monthly Sales")
ax_bar.set_ylabel("Sales")
canvas_bar = FigureCanvasTkAgg(fig_bar, bar_frame)
canvas_bar.get_tk_widget().pack()

# Run the application
root.mainloop()
Master Tkinter Frames: Organize Your GUI Effectively | #Python #Tkinter #PythonGUI

View and Download tkinter-frame ipynb file ( .html format )
Need a Scrollable Frame?
Standard Tkinter Frames do not support scrollbars by default. If your layout has many widgets that exceed the window height, learn how to create a Scrollable Frame using a Canvas and dynamic Grid layouts.
🚀
Take it to the next level!
Now that you've mastered the scrollable frame, learn how to add Dynamic Search & Real-time Filtering to your data rows. View the Search & Filter Tutorial →
Grid Layout Python Tkinter pack place layout rowconfigure() & columnconfigure() LabelFrame

Subhendu Mohapatra
Author
🎥 Join me live on YouTubePassionate about coding and teaching, I publish practical tutorials on PHP, Python, JavaScript, SQL, and web development. My goal is to make learning simple, engaging, and project‑oriented with real examples and source code.
Subscribe to our YouTube Channel here
This article is written by plus2net.com team.
https://www.plus2net.com

 Python Video Tutorials