Dynamic creation of Columns & headers of Treeview
";require "templates/body_start.php";?>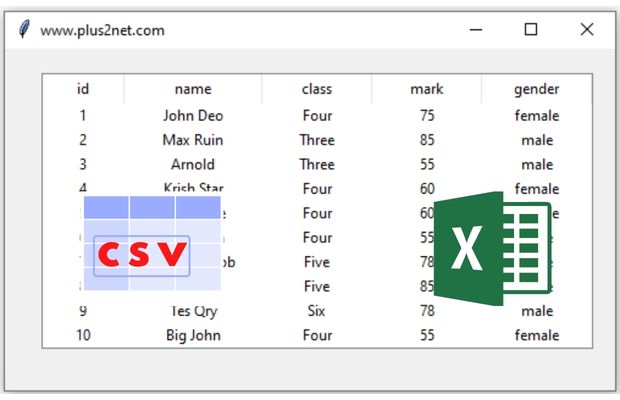
Sample data from different Data Sources
Sample data in Excel, CSV, MySQL dump, SQLite databae, Pandas DataFrameNumber of columns to display
When we collect data from the source ( database table or Excel or CSV file ) we are not sure how many columns will be available. Here are some SQL which collects different number of columns from the tableSELECT id,name FROM student SELECT id,name,class FROM studentSELECT * FROM studentThis way we will not have any fixed number of columns and based on the source or data, we have to create the columns.
For our easy understanding let us create one list and use the elements as column headers. We can replace our list with data from Database table.
l1=['id','Name','Class','Mark','Gender']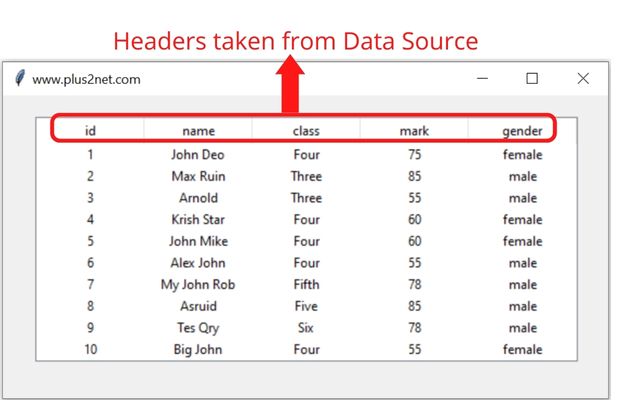
We will replace the list l1 in above code with our data column headers and for that we have used our MySQL table. Note that source can be SQLite database or Excel or Pandas DataFrame or any other source.
Creating the Treeview
trv = ttk.Treeview(my_w, selectmode ='browse')trv.grid(row=1,column=1,padx=30,pady=20)Tkinter Treeview displaying data rows with headers from different source like CSV file & Excel
MySQL database table as data source
from sqlalchemy import create_engine,textmy_conn = create_engine("mysql+mysqldb://userid:pw@localhost/my_db")my_conn = my_conn.connect()r_set=my_conn.execute(text('SELECT * FROM student'))l1=[r for r in r_set.keys()] # List of column headers r_set=[r for r in r_set] # Rows of data#l1=['id','Name','Class','Mark','Gender']MySQL Database
SQLite database as data source
from sqlalchemy import create_engine,textmy_conn = create_engine("sqlite:///E:\\testing\\sqlite\\my_db.db")my_conn=my_conn.connect()r_set=my_conn.execute(text('SELECT * FROM student'))l1=[r for r in r_set.keys()] # List of column headers r_set=[r for r in r_set]Pandas DataFrame as source
import pandas as pd df = pd.read_excel('D:\student.xlsx') # create dataframe using xlsx filel1=list(df) # List of column names as headers r_set=df.to_numpy().tolist() # Create list of list using rows Excel file as source
from openpyxl import load_workbookwb = load_workbook(filename='D:\student.xlsx', read_only=True)ws = wb['Sheet1']r_set = [row for row in ws.iter_rows(values_only=True)]l1=r_set.pop(0) # Collect the first row as column headers wb.close()# Close the workbook after readingcsv file as data source
import csvfile = open('D:\student.csv') # file object for student.csv file csvreader = csv.reader(file) l1 = []l1 = next(csvreader) # column headers as first row r_set = [row for row in csvreader]Adding headers and columns to Treeview ( dynamically )
The list l1 is created using any of the above data sources. Here one sample list is given.#l1=['id','Name','Class','Mark','Gender'] # sample list for testing# Using treeview widgettrv = ttk.Treeview(my_w, selectmode ='browse')trv.grid(row=1,column=1,padx=30,pady=20) # grid to place trv['height']=5 # Number of rows to display, default is 10trv['show'] = 'headings' # Adding headers and columns using lists trv["columns"] = l1# Defining headings, other option in tree# width of columns and alignment for i in l1: trv.column(i, width = 100, anchor ='c') # Headings of respective columns trv.heading(i, text =i)Adding data to Treeview
We will add data collected from the above query to Treeview.for dt in r_set: v=[r for r in dt] # collect the row data as list trv.insert("",'end',iid=v[0],values=v)Number of rows to display
In our Treeview we can manage the number of records to display . Note that here we have the browse option to scroll to more records.trv['height']=5 # Number of rows to display, default is 10Tkinter Treeview displaying data from different source like Pandas DataFrame MySQL & SQLite table
Full code with different data sources is here.
Un-comment the data source you want to use.
from tkinter import ttkimport tkinter as tk# Creating tkinter my_wmy_w = tk.Tk() # root or parent window my_w.geometry("560x280") # width and height of window my_w.title("www.plus2net.com") # title# MySQL database as datasource from sqlalchemy import create_engine,text my_conn = create_engine("mysql+mysqldb://id:pw@localhost/my_db")my_conn = my_conn.connect()r_set=my_conn.execute(text('SELECT * FROM student'))l1=[r for r in r_set.keys()] # List of column headers r_set=[r for r in r_set] # Rows of data### SQLite database as data source ###'''from sqlalchemy import create_engine,textmy_conn = create_engine("sqlite:///E:\\testing\\sqlite\\my_db.db")my_conn=my_conn.connect()r_set=my_conn.execute(text('SELECT * FROM student'))l1=[r for r in r_set.keys()] # List of column headers r_set=[r for r in r_set]'''# Using Pandas DataFrame as data source'''import pandas as pd df = pd.read_excel('D:\student.xlsx') # create dataframe l1=list(df) # List of column names as headers r_set=df.to_numpy().tolist() # Create list of list using rows '''# openpyxl library for reading data from Excel file '''from openpyxl import load_workbookwb = load_workbook(filename='D:\student.xlsx', read_only=True)ws = wb['Sheet1']r_set = [row for row in ws.iter_rows(values_only=True)]l1=r_set.pop(0) # Collect the first row as column headers wb.close()# Close the workbook after reading'''# Using CSV file '''import csvfile = open('C:\\data\\student.csv') # Path of CSV data filecsvreader = csv.reader(file)l1 = []l1 = next(csvreader) # column headers as first row r_set = [row for row in csvreader]'''# Data Sources to create header list and row of data is over. #l1=['id','Name','Class','Mark','Gender'] # sample list for testing# Using treeview widgettrv = ttk.Treeview(my_w, selectmode ='browse')trv.grid(row=1,column=1,padx=30,pady=20) # grid to place trv['height']=5 # Number of rows to display, default is 10trv['show'] = 'headings' # Adding headers and columns using lists trv["columns"] = l1# Defining headings, other option in tree# width of columns and alignment for i in l1: trv.column(i, width = 100, anchor ='c') # Headings of respective columns trv.heading(i, text =i)## Adding data to treeview for dt in r_set: v=[r for r in dt] # creating a list from each row trv.insert("",'end',iid=v[0],values=v) # adding row#data=[1,'Alex','Four',45,'Male'] # sample data to insert #trv.insert("",'end',iid=1,values=data)my_w.mainloop() # keep the window openTkinter Treeview to display report based on selection of Month from Combobox from MySQL table
Dynamic Treeview columns in Tkinter | Update Data | Python GUI Tutorial | #Python #Tkinter
Search DataFrame by user inputs through Tkinter. Display MySQL records in Treeview Pagination of MySQL records in Treeview
Displaying MySQL records using Entry or Label Delete MySQL record
TreeviewTreeview insert Treeview parent child nodeSelect -Edit-update MySQL Product table using Treeview Query window & displaying records in Treeview