Displaying Pandas graphs on tkinter
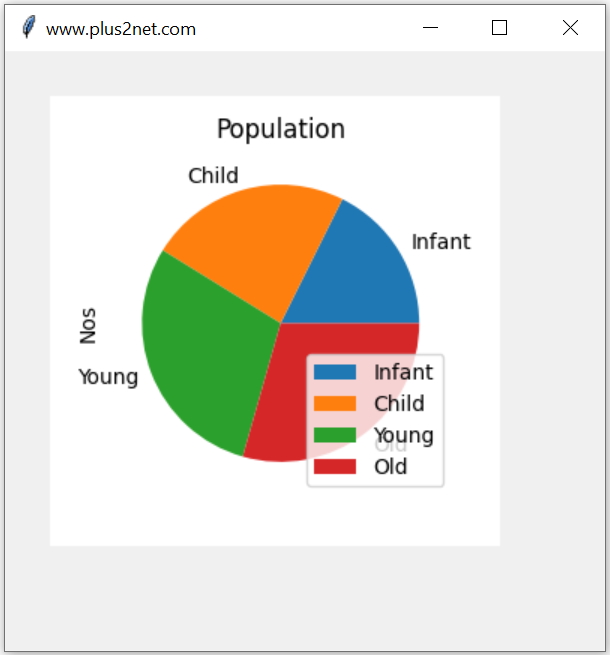
Plotting graphs in Tkinter generated from Pandas dataframe using data from MySQL or SQLite database
import pandas as pd
from matplotlib.backends.backend_tkagg import FigureCanvasTkAgg
my_dict={'NAME':['Infant','Child','Young','Old'],'Nos':[30,40,50,50]}
df = pd.DataFrame(data=my_dict)
lbl=['Infant','Child','Young','Old']
fig1=df.plot.pie(title="Population",y='Nos',
figsize=(3,3),labels=lbl).get_figure();
import tkinter as tk
my_w = tk.Tk()
my_w.geometry("400x400") # Size of the window
my_w.title('www.plus2net.com')
plot1 = FigureCanvasTkAgg(fig1, my_w)
plot1.get_tk_widget().grid(row=1,column=1,padx=30,pady=30)
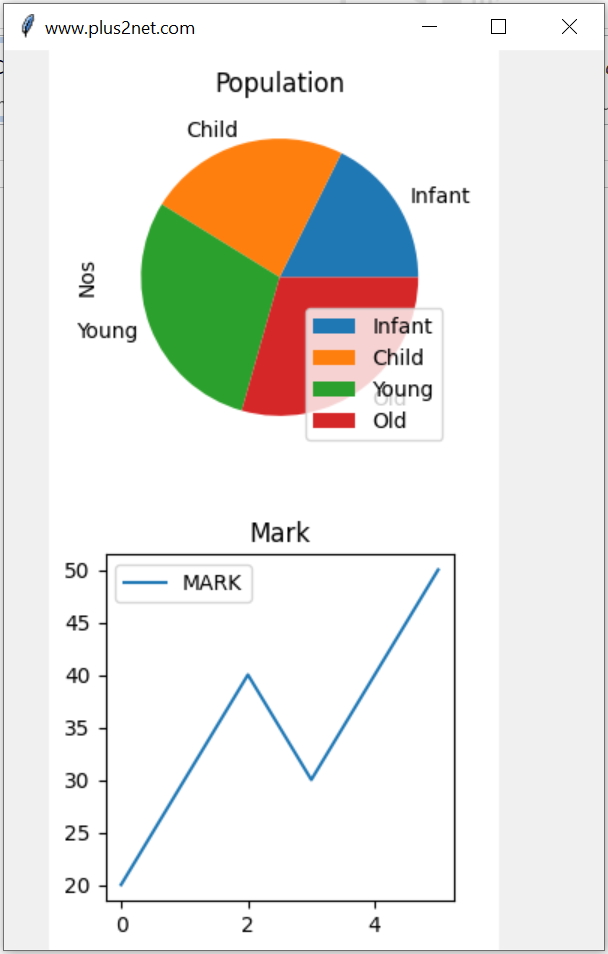
my_w.mainloop() # Keep the window openMultiple plots in same window.
import pandas as pd
from matplotlib.backends.backend_tkagg import FigureCanvasTkAgg
my_dict={'NAME':['Infant','Child','Young','Old'],'Nos':[30,40,50,50]}
df = pd.DataFrame(data=my_dict)
lbl=['Infant','Child','Young','Old']
fig1=df.plot.pie(title="Population",y='Nos',
        figsize=(3,3),labels=lbl).get_figure();

my_dict={'NAME':['Ravi','Raju','Alex',
        'Ron','Geek','Kim'],
'MARK':[20,30,40,30,40,50]}
df = pd.DataFrame(data=my_dict)
fig2=df.plot.line(title="Mark",y='MARK',
        figsize=(3,3)).get_figure();

import tkinter  as tk
my_w = tk.Tk()
my_w.geometry("400x600")  # Size of the window
my_w.title('www.plus2net.com')
plot1 = FigureCanvasTkAgg(fig1, my_w)
plot1.get_tk_widget().grid(row=1,column=1,padx=30)
plot2 = FigureCanvasTkAgg(fig2, my_w)
plot2.get_tk_widget().grid(row=2,column=1,padx=30)
my_w.mainloop()  # Keep the window open
Dynamic plots using database
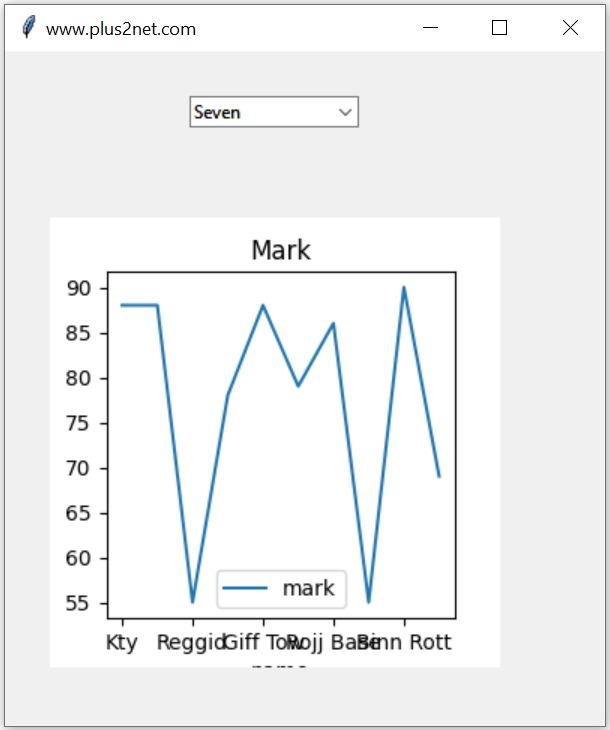
We can create the graphs dynamically based on user inputs. For this here we have used one Combobox where we displayed the list of classes of our student table. User can select one class from the list and on selection of the class the marks of students of the selected class is collected and the graph is generated.
Initially the Combobox is populated by using unque class names ( distinct query ) from the student table.
query="SELECT distinct(class) as class FROM student"
my_data=my_conn.execute(query) # SQLAlchem engine result
my_list = [r for r, in my_data] # default options for comboboxquery="SELECT name,mark FROM student WHERE class='"+sel.get()+"'"
df = pd.read_sql(query,my_conn,index_col='name')sel.trace('w',my_upd) # track the change event from sqlalchemy import create_engine
import pandas as pd
from matplotlib.backends.backend_tkagg import FigureCanvasTkAgg
# for MySQL database use the below line
my_conn = create_engine("mysql+mysqldb://root:test@localhost/my_tutorial")
# for SQLite database use the below line.
#my_conn = create_engine("sqlite:///D:\\testing\\sqlite\\my_db.db")
query="SELECT distinct(class) as class FROM student"
my_data=my_conn.execute(query) # SQLAlchem engine result
my_list = [r for r, in my_data] # default options for combobox
import tkinter as tk
from tkinter import ttk
my_w = tk.Tk()
my_w.geometry("400x450") # Size of the window
my_w.title("www.plus2net.com") # Adding a title
def my_upd(*args): # On selection of options
query="SELECT name,mark FROM student WHERE class='"+sel.get()+"'"
    df = pd.read_sql(query,my_conn,index_col='name')
#print(df)
#fig1=df.plot.pie(title="Marks",y='mark',
# figsize=(3,3)).get_figure();
fig1=df.plot.line(title="Mark",y='mark',
figsize=(3,3)).get_figure();
plot1 = FigureCanvasTkAgg(fig1, my_w)
plot1.get_tk_widget().grid(row=2,column=1,padx=30,pady=30)
sel=tk.StringVar() # string variable
cb1 = ttk.Combobox(my_w, values=my_list,width=15,textvariable=sel)
cb1.grid(row=1,column=1,padx=30,pady=30)
sel.trace('w',my_upd) # track the change event
my_w.mainloop() # Keep the window openResizing image using PIL Upload and display image file Create QR Code in Tkinter window

Subhendu Mohapatra
Author
🎥 Join me live on YouTubePassionate about coding and teaching, I publish practical tutorials on PHP, Python, JavaScript, SQL, and web development. My goal is to make learning simple, engaging, and project‑oriented with real examples and source code.
Subscribe to our YouTube Channel here
This article is written by plus2net.com team.
https://www.plus2net.com

 Python Video Tutorials